Is The Stock Rally Glass Half Full Or Half Empty?

The February stock market bounce has reached a crossroads – will there be another leg higher or has the rally run its course?
The rally in stocks has reached an key juncture it would seem in many of the major indices. That includes our favorite index: the Value Line Geometric Composite (VLG). Once again, the VLG is an unweighted average of approximately 1700 stocks. The calculation of the index amounts to essentially the median stock performance among that universe. Thus, in our view, it is probably the best gauge of the true health of the broad stock market. If that is the case, the market’s health is truly up in the air at this point.
Consider first where the VLG is coming from. On January 6, the VLG broke down from what we determined to be a pass/fail line of support around 436, based on key Fibonacci Retracement levels of the post-2009 bull market. Indeed, the index plunged immediately and severely upon breaking that level. The next support we earmarked below stood at 382, or about 12% lower. It took the VLG just 2 weeks to hit that level, which we noted on January 20.
The index held that 382 level on January 20, as well as on a subsequent re-test on February 11. Since then, the VLG has bounced solidly, moving as high as 415 yesterday before encountering multiple resistance layers. Today, the VLG, settled at 409.85. As quant-oriented managers, this is an interesting juncture to us. To wit: a move from 409 back up to 436 would mark a rise of +6.6015%. Meanwhile, a drop back down to 382 from 409 would signify a loss of -6.6015%. So which spot is the next destination? Or, in other words, is the rally glass half full or half empty?
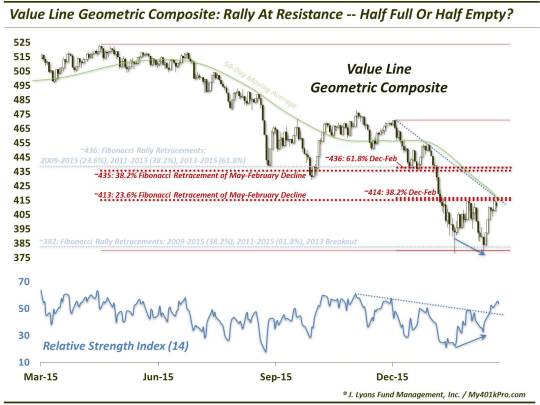
First off, what sort of potential resistance are we seeing in this vicinity?
The layers of potential resistance are plentiful and formidable, enough to engender a “half-empty” attitude.
Among others, they include
- The 23.6% Fibonacci Retracement of the May-February decline
- The 38.2% Fibonacci Retracement of the December-February decline
- The late January bounce highs
- The post-December Down trendline
- The 50-day simple moving average
Price is truth, as they say, and the onus is certainly on the bulls to prove that they can vault the VLG over this area of resistance. That said, there are plenty of clues to be found beyond price that often serve instructively in determining where prices are likely to go. This includes price-based derivative indicators (e.g., Relative Strength Index,or RSI) that measure the degree of momentum within a move. While we do not typically use these classical technical analysis tools, they are very popular among traders and can prove useful at times.
For example, traders often use RSI to spot divergences in price vs. momentum. For example, note on the chart how the VLG made a lower closing low in February versus its January 20 low, while RSI held above that initial low. This positive divergence can (but not always) give a head’s up regarding a potential upside reversal. In this case, prices did indeed turn up, leading to this late February rally. Note also the post-December down trendlines on price and RSI. The VLG is bumping into the trendline while the RSI has broken above. This is another potential positive divergence that could be a harbinger of a trendline break in prices as well. Mark one down for the glass “half-full” crowd.
Lastly, while price is the final arbiter of market action, it is not exactly predictive. That is why we use a stable of indicators based on various measures of breadth and momentum of breadth, et al. to instruct us as to the likely course of future prices. While this approach does not always hold true, particularly for indices that are heavily weighted toward a relatively small number of constituents, it is especially helpful on a broad, equal-weight index like the VLG. Currently, we would assess the status of most of these proprietary indicators as “constructive”. That is, they are positively oriented and supportive of potentially higher prices.
So where’s the next stop for stock prices, 6.6015% higher or lower? While the immediate resistance is considerable, there is ample evidence to suggest that prices could overcome that resistance eventually. We understand that a rally of that magnitude represents a fairly modest goal for investors. However, if our longer-term assessment of the stock market is close to accurate, considering the likely potential range of prices over the next 6 months to several years, we would take that gain in a heartbeat.
Consider it a bearish “glass half-full” view.
________
More from Dana Lyons, JLFMI and My401kPro.
The commentary included in this blog is provided for informational purposes only. It does not constitute a recommendation to invest in any specific investment product or service. Proper due diligence should be performed before investing in any investment vehicle. There is a risk of loss involved in all investments.


