Small-Caps Approaching Rally Test

The Russell 2000 Small-Cap Index is nearing a level containing multiple layers of
potential
resistance.
Earlier this week, we posted a discussion regarding the prospects for the current stock market rally (”Is The Stock Rally Glass Half Full Or Half Empty?”). Our view was that, despite a growing (or growling) consensus that a resumption of the selloff, or an outright crash, was imminent, several factors lined up in favor of a continuation of the advance – at least in the near-term. This included favorable readings in some of our proprietary breadth indicators, positive momentum action and unusually elevated levels of bearish fund flows. It’s only been 3 days since that post, but after a Wednesday AM scare, stocks have indeed continued their late-February march upward. This latest move is taking some indexes close to potentially significant resistance levels. That includes the Russell 2000.
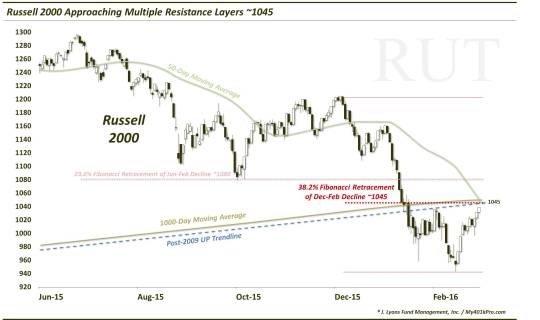
Multiple layers of potential resistance lie in the vicinity of 1045-1050 on the Russell 2000 chart (trading at 1039 as I type). These layers include:
- the 38.2% Fibonacci Retracement of the December-February decline
- the 50-day simple moving average
- the 1000-day simple moving average
- the underside of the post-2009 bull market Up trendline that was broken in January
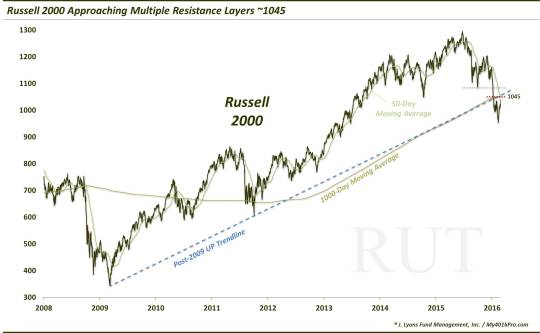
Zooming out, we can see the significance of the trendline test and the 1000-MA, especially.
These levels represent solid challenges to the Russell 2000 rally on their own. Collectively, they should provide a substantial hurdle for the index upon reaching the 1045 area. Assuming the index reaches this level, we can see 4 potential outcomes.
- The Russell 2000 is rejected at the resistance level, ending the current bounce and sending the indexes back toward their January-February lows.
-
The Russell 2000 breaks through the resistance level for a day or two before dropping back below it, thus putting in a false breakout, ending the current bounce and sending the indexes back toward their January-February lows.
-
The Russell 2000 is temporarily rejected at the resistance level, leading to a pullback or consolidation before eventually building on the aforementioned positives and breaking through to fulfill the market’s intermediate-term potential.
-
The Russell 2000 shoots right up through the resistance level, immediately building on the aforementioned positives and fulfilling the market’s intermediate-term potential.
Which option would be our best guess for the eventual outcome of this test (assuming it occurs)? We’re not ones to forecast so we’ll watch prices and our indicators and let them tell us what IS happening. OK, so if we were forced to guess, it would probably be some combination of 2 & 3. Our guess is that this level does put up some resistance, at least temporarily. Should it break through, it would be a real feather in the bulls’ caps…if it holds. We still don’t totally trust this market in the near-term so we would not sleep on a breakout either, lest the false breakout happen to show up.
The market likes to do whatever will fool the most people. So while this level should at least be an interesting one in producing a battle between the Russell 2000 bulls and the bears, it would also be an ideal spot for the market to unleash its shenanigans.
________
More from Dana Lyons, JLFMI and My401kPro.
The commentary included in this blog is provided for informational purposes only. It does not constitute a recommendation to invest in any specific investment product or service. Proper due diligence should be performed before investing in any investment vehicle. There is a risk of loss involved in all investments.


