The January Bear-ometer

Very weak January’s have had a tendency to lead to weak long-term returns in the stock market.
Investors must be thinking, “thank God February is here.” Well, before we put the brutal January to rest, we have one more depressing post. We wrote several posts throughout January on the historic weakness and volatility that was occurring during the month. Previous looks at intra-month variations on the “January Barometer” have pointed to weak returns going forward for stocks. This post will just put a bow on things as we look at the dismal month-end tally and whether it suggests weakness as well.
First off, what was the dismal tally? Well, as of last Monday, the stock market was down -8.84%, judging by the Dow Jones Industrial Average. At that point, it would have marked the worst opening month in 116 years. As it happens, the DJIA rallied furiously over the last 2 days of the month. Even with that rally, though, the DJIA still closed the month down -5.6%, the worst since 2009, and 1990 before that (FYI, we are using the DJIA simply because we have the most historical data on the index).
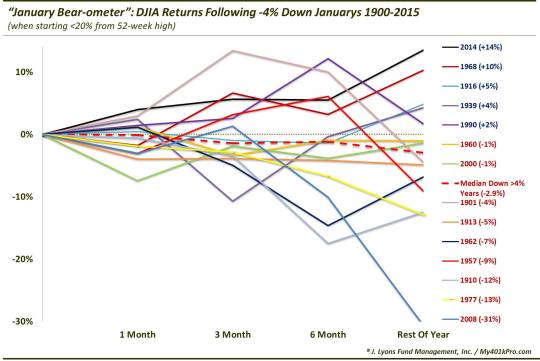
Can anything be gleaned by looking at other weak January’s, historically? Well, with the usual disclaimers that these seasonal patterns are merely averages and past results do not guarantee anything about future returns, etc…,we took a look at the historical stats. Using the DJIA since 1900, there have been 18 other years in which the DJIA lost at least 4%. Since we are trying to find reasonable comparisons to our present case, we thought to weed out years in which the DJIA had already suffered considerable weakness. Somewhat arbitrarily, we eliminated 4 years that saw the index already down over 20% from its 52-week high coming into the year (1941, 1970, 1978 and 2009).
We were then left with 14 years that began with the DJIA within 20% of its 52-week high and experienced January losses in excess of 4%.
1901 (-6.2%)
1910 (-6.5%)
1913 (-5.4%)
1916 (-8.7%)
1939 (-6.9%)
1957 (-4.1%)
1960 (-8.4%)
1962 (-4.3%)
1968 (-5.5%)
1977 (-5.0%)
1990 (-5.9%)
2000 (-4.8%)
2008 (-4.6%)
2014 (-5.3%)
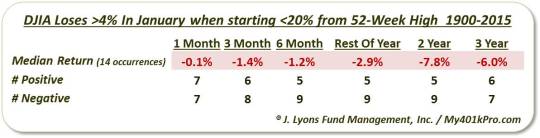
Returns following the majority of these January’s were significantly weak, as the median returns indicate here. This is especially the case over the longer-term, i.e., up to 3 years later.
Here is the performance following these events in table format.
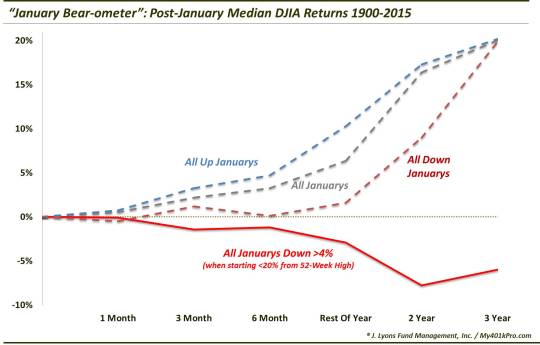
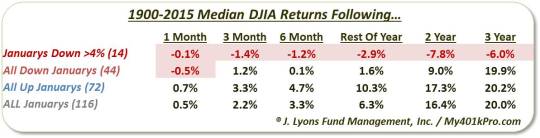
The tendency for weakness following these dismal January’s is especially evident when contrasted with the median performance following all January’s, all “up” January’s – and even versus all “down” January’s.
Again, in table format.
If you believe in these historical, seasonal patterns, there would appear to be something noteworthy about these especially bad January’s. Incidentally, we would rank seasonal factors toward the bottom of our list of investment inputs. That said, the compilation of evidence from all of our posts looking at January weakness makes for a compelling bearish argument – especially over the longer-term, e.g., years.
In other words, if there is validity to the January Barometer, it may more appropriate to call it the January “Bear-ometer” in 2016.
________
More from Dana Lyons, JLFMI and My401kPro.
The commentary included in this blog is provided for informational purposes only. It does not constitute a recommendation to invest in any specific investment product or service. Proper due diligence should be performed before investing in any investment vehicle. There is a risk of loss involved in all investments.


