“Average” Stock Index Facing Key Test

Many of the major averages are facing areas of key resistance in their post-February rallies – including the Value Line Arithmetic Index.
About a week ago, the theme of much of our market dialogue and posts began to focus on the approaching ubiquitous chart resistance facing most of the major stock averages. In other words, after quickly bouncing some 10% or so (or 30%) off of the February lows, the global stock rally was likely about to get more difficult. This scenario has played out, not surprisingly given the significant levels of resistance near present levels on most charts. That includes, among many others, the Global Dow which we mentioned yesterday, and the Value Line Arithmetic Index (VLA).
Once again, the VLA is a useful barometer of the health of the overall market as it is an unweighted average of about 1700 stocks. We do slightly prefer its sister “Geometric” index, which measures the median performance of the universe, versus the Arithmetic index which measures the average performance. But they are both useful in their own right.
Case in point, on December 18, we pointed out that, ominously, the VLA was breaking below its post-2009 Up trendline. This suggested a loss of some key support and a vulnerability to more downside, and in short order. Indeed, after briefly attempting to stabilize back above the trendline, the VLA succumbed to the weakness we feared, dropping an additional roughly 12% over the next month.
Since then (and a February re-test), however, the VLA has rallied back impressively, as have many indices. In fact, the VLA has recovered all of the losses incurred following its post-2009 trendline break. Reclaiming that trendline now becomes the challenge.
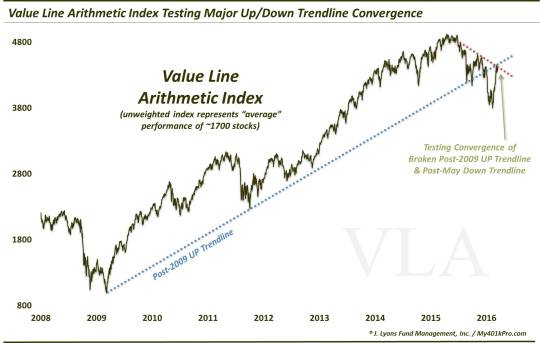
Converging in the same area as that post-2009 Up trendline now is the Down trendline connecting the peaks from last summer’s top. That makes the nearby level a double challenge for the VLA (although, we have seen many times where a trendline convergence acts almost like a portal and price jumps through it).
The larger, recent theme remains, though. That is, multiple potential resistance levels are converging near present prices on the charts of most major indices. Thus, the sledding should get tougher from here for the stock market rally as it works out whether it’s going to make another run at new highs – or whether it’s just an average bear market rally.
_____________
More from Dana Lyons, JLFMI and My401kPro.
The commentary included in this blog is provided for informational purposes only. It does not constitute a recommendation to invest in any specific investment product or service. Proper due diligence should be performed before investing in any investment vehicle. There is a risk of loss involved in all investments.


