Micro-Caps Can’t Get Off The Mat

Despite glowing breadth statistics during the recent rally, the micro-cap space is one area that hasn’t kept pace.
When considering the “quality” of the post-February stock rally, one of the biggest positives has been the excellent breadth. It remains to be seen whether it will provide the springboard for a longer-term advance – or if it was merely a display of mean-reversion, given the broad market’s gross under-performance during the 6 months prior. However, no one can reasonably complain about a lack of participation. Of some concern, though, there is one area that has struggled to keep up with the broad rally: micro-caps.
Comprising some of the smallest of the listed companies in the U.S. market, micro-caps have notably lagged their peers of late, even the traditional small-caps. Yes, the group, as measured by the iShares Russell Micro-Cap ETF (ticker, IWC), has rallied roughly 13% from its February low to its recent rally high, almost exactly in line with the rally in the SPDR S&P 500 Large-Cap ETF (ticker, SPY). However, given the significantly higher beta of micro-cap stocks, the bounce certainly should have well exceeded that of the SPY.
Quantitatively, consider what that 13% move represents. For the SPY, the 13% equates to a 73% retracement of the decline from last May to February, and a 78% retracement of the decline since November. The same 13% rally in the IWC only retraced 32% of its decline since June and 44% of the decline since December. That is not keeping pace.
Another way to measure micro-cap performance is simply via a performance ratio versus the SPY. When the IWC:SPY ratio is rising, micro-caps are out-performing. When the line is dropping, micro-caps are under-performing. After peaking in early 2014, the ratio has dropped considerably. And after hitting a lower high in June, the IWC:SPY ratio dropped precipitously, indicating the severe under-performance of the micro-caps. By December, it had hit a new low since 2009.
After dropping into the low in February, the ratio bounced a bit in the early stages of the recent rally. However, unlike other broad small-cap and mid-cap averages that saw their post-February strength persist, the micro-cap rally has petered out. In fact, the lagging in micro-cap stocks has been so egregious that the IWC:SPY has already found itself back at a 7-year low.
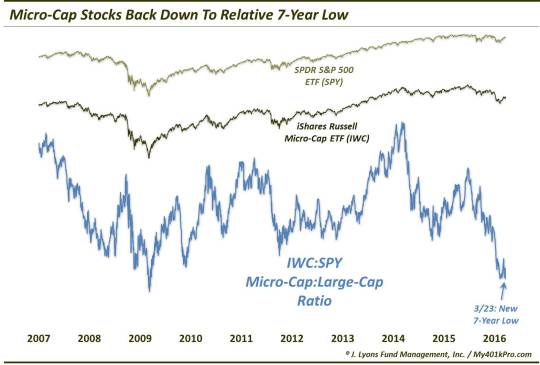
So what’s the big deal if micro-caps are under-performing? Well for one, it presents a bit of counter-evidence to the “strong breadth thrust” case. Furthermore, the relative performance of micro-caps, like any high-beta sector, can serve as an indication of the willingness of investors to take on risk. As the chart shows, the IWC:SPY ratio generally trended upward during the favorable markets from the 2009 low into 2011 and from the 2011 low into 2014. Conversely, the ratio has traditionally fallen during “risk-off” periods in the market, most notably from 2007-2009.
The point is that, at least based on the relative performance of micro-caps, the investment landscape may not be as optimistic as the strong breadth and momentum since February might suggest. Yes, it is only a small segment of the equity market. But if micro-caps can’t get off the mat here, it may be an indication that investors are not willing to fully take on risk yet – putting any hopes of a durable rally on hold.
_________
Muhammad Ali photo from Daily Mirror.
More from Dana Lyons, JLFMI and My401kPro.
The commentary included in this blog is provided for informational purposes only. It does not constitute a recommendation to invest in any specific investment product or service. Proper due diligence should be performed before investing in any investment vehicle. There is a risk of loss involved in all investments.


