Options Traders Head For The Hills

Call buying of stock options has been extremely subdued relative to puts recently – typically a bullish contrarian signal; however…
We are not the first or only ones to point out that the current post-February stock rally has been less than enthusiastically received by the trading community. While there are some exceptions, most intermediate-term sentiment gauges are either leaning towards fear levels or, at best, neutral. One example comes from the equity options market where daily call buying in recent days has reached a nearly unprecedented streak of subdued levels relative to put buying. This has typically been a bullish sign for the market – however, the current signal is anything but typical.
To wit: We’ve covered the International Securities Exchange Equity Call/Put Ratio (ISEE) on several occasions over the years. As a refresher, due to its unique construction, the ISEE has been a favorite indicator of ours for highlighting short-term inflection points in investor sentiment. The ISEE excludes firm trades that are quite likely to be hedges and also excludes volume on closing positions when calculating the Call/Put ratio. Therefore, the ISE argues that its ratio is a more pure indication of investor sentiment than some of the other options ratios.
The 100 level in the ISEE has historically often been a signal that options traders are becoming fearful (100 means equal call and put volume). Dips below that level have been common near short to intermediate-term lows in the market as traders have either stormed into puts and/or have shied away from buying call options. Therefore, stock market returns have been quite bullish following such readings. And they have been particularly bullish after the ISEE has been below 100 for consecutive days. This had occurred just 11 times since the inception of the ISEE data in 2006.
Now, you can make it 12. Only, it hasn’t just been 2 days in a row, but 4 that the ratio has been below the 100 level. This is 2nd longest streak ever, behind the 5-day streak from February 5-11 this year.
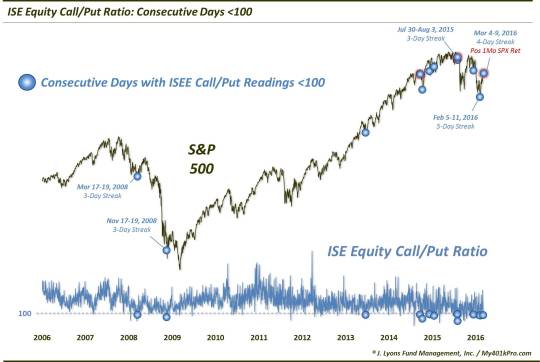
These are the dates of all 12 occurrences:
- March 17-19, 2008 (3 days)
- November 17-19, 2008 (3 days)
- June 20-21, 2013
- September 22-23, 2014
- October 13-14, 2014
- December 11-12, 2014
- January 20-21, 2015
- July 30-August 3, 2015 (3 days)
- August 6-7, 2015
- December 17-18, 2015
- February 5-11, 2016 (5 days)
- March 4-9, 2016 (4 days)
You may recognize some of the dates right off the bat as short to intermediate-term lows. Indeed, the general pattern has been that, after a few volatile days, the S&P 500 consistently out-performs over the next few weeks to months. Here are the statistics:
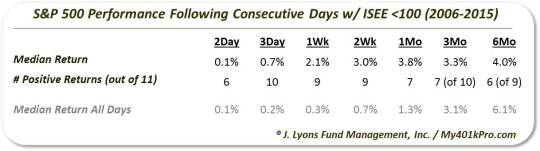
As the table shows, S&P 500 returns 2 days after the streak ended were a toss-up. Amazingly, by the following day, 10 of the 11 were positive. And the performance stayed good in the weeks-months following as well. 9 of the 11 were positive 1-2 weeks later. And the median return after 1 month was +3.8%, 3 times the S&P 500′s normal return. So, do we have a green light here to buy stocks? Not so fast…
The setup surrounding the current version of this streak is somewhat atypical compared to the others. And the reasons that make it atypical somewhat align it with prior instances which failed to lead to positive returns going forward, namely September 2014 and August 2015. Why is it atypical? The readings are occurring into a 1-month rally, rather than into a selloff, which is the norm. Consider the following:
- At +7.40%, it is the only streak besides August 2015 that occurred when the S&P 500′s 1-month return was positive. Add in September 2014 (-0.76%), and you have the only 3 events with 1-month returns better than -2.35%.
- Similarly, at roughly 18 yesterday, it is the only event besides last August and September 2014 to occur while the S&P 500 Volatility Index (VIX) was trading at less than an 19-handle.
What this all spells out is that our present circumstances do not necessarily paint the picture of short-term “fear” that has accompanied most of the other occurrences. It does not guarantee that the stock market will follow in the footsteps of last August and September 2014 and suffer considerable weakness from here. However, in our view, the circumstances surrounding the current streak definitely temper the confidence in an imminent, fear-driven short-term bounce.
Furthermore, the increasing occurrences of sub-100 readings over the past 18 months are causing us to question the usefulness of this once very accurate indicator, at least when occurring in these atypical circumstances. Thus, while we certainly would not argue that this is a bearish signal, it can’t be trusted as the bullish signal it once was.
________
Photo by Keith Alexander.
More from Dana Lyons, JLFMI and My401kPro.
The commentary included in this blog is provided for informational purposes only. It does not constitute a recommendation to invest in any specific investment product or service. Proper due diligence should be performed before investing in any investment vehicle. There is a risk of loss involved in all investments.


