Did THIS Just Breathe New Life Into The Bull Market?

The NYSE advance-decline line closed at a new all-time high yesterday; will that breathe new life into the bull market, or is the bull still gasping for air?
Some days are more important than others in the stock market. Yesterday may have been one of those days as we saw a number of potentially positive developments. For one, many of the lagging sectors in the market (e.g., growth, international, small-caps, financials, etc.) demonstrated seeming breakouts of some magnitude. A rotation into – or at least contributions from – these areas will be necessary to sustain a more durable rally. We will closely monitor these areas for signs of follow through. The most significant development yesterday though, in our view, was the new all-time high in the NYSE advance-decline line.
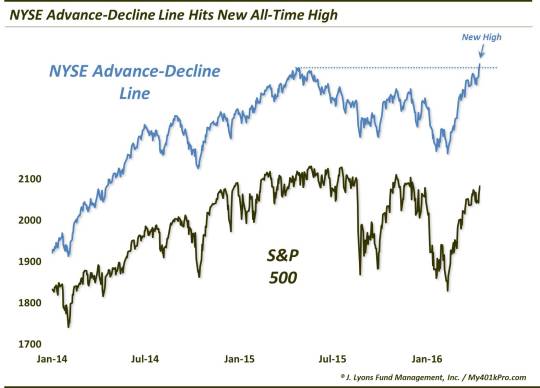
For the uninitiated, the advance-decline line is a running cumulative total of the daily difference between advancing issues on the NYSE and declining issues. If this “A-D” Line is moving upward along with the stock indexes, it represents strong participation within the broader market. And as we have said many times, the better the participation, the healthier the market. Since the mid-February stock market low, the A-D Line has indeed been moving upward, hitting its first new high yesterday in 355 days.
So what is the significance of the new high? Let’s revisit a post from May 21 of last year. In it, we discussed the topic of the A-D Line hitting a new high along with the S&P 500 – or rather, not hitting a new high. As it happened, the S&P 500 had in the days prior reached a new all-time high, slightly above the level reached on April 24. Meanwhile, the A-D Line was negatively diverging, i.e., it was unable to surpass its own high from April 24.
Why was that important? As we noted in the post,
the NYSE A-D Line has negatively diverged at every cyclical top in the S&P 500 in the last 50 years (by the way, that day, May 21, marked the precise all-time high close in the S&P 500 to date…golf clap).
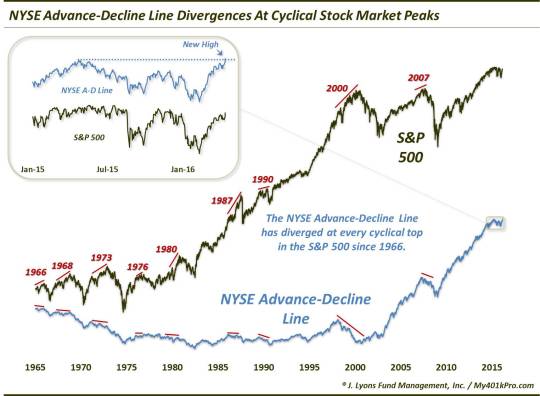
Now does this mean the market has to top every time there is a divergence? No. Furthermore, the A-D Line can, and has, diverged for prolonged periods before any ill effects are felt in the stock market. Still, given the plethora of concerns we had regarding a possible cyclical top at the time, and given the fact that this mere 1-month divergence was the first real divergence during the course of the 6-year bull market, this was a development that demanded recognition. It was an important piece of the “topping” puzzle that had been missing, and was now in place.
So what now? Does the new high in the A-D Line mean the bull market is back on track – or never left? We say yes…and no. Let’s start with no. Our best guess still, based on all the evidence at hand, is that the broad stock market formed (or is still forming) a cyclical top over the past 12 months. We realize that may be a difficult proposition to grasp for market observers who only watch the price of the S&P 500.
However, consider the fact that broader averages like the NYSE Composite, the Value Line Arithmetic Index (i.e., average stock) and The Value Line Geometric Composite (i.e., median stock) are still 8%, 7% and 12% below their highs of a year ago. Also consider the litany of examples of deterioration in market internals that we’ve documented over the past year which have traditionally led to multi-year struggles in the broad equity market. These factors (and others) combined still point to a strong likelihood that the market action of the past 12 months is part of a topping process.
Why do we say “yes”, the bull may be back on track? Strictly based on the historical relationship of the NYSE A-D Line and S&P 500 around cyclical tops, the evidence would suggest that the S&P 500 has not yet made its final high for the cycle. Remember that the A-D Line has topped before the index at every cyclical top in the last 50 years, without exception. The fact that the NYSE A-D Line hit a new high yesterday tells us that A) the A-D Line has not yet diverged and, therefore, B) the S&P 500 has not yet topped.
Now even if this relationship holds true and the final top is still ahead of us, it does not tell us how far out or how much higher the S&P 500 rally might extend. The A-D Line could top next week and the index shortly following for all we know. However, if history holds true to form here, the S&P 500 all-time high close of 2130.82 on May 21, 2015 will not be the final high of this cycle.
The 1976 Episode
One quirk in the S&P 500/A-D Line relationship occurred around the cycle top in 1976. On September 21 of that year, the S&P 500 hit a new cycle high. Meanwhile, the NYSE A-D Line closed just below its previous high set that February, establishing the negative divergence. That date did indeed prove to be the cycle high for the S&P 500 as it would go on to drop into its cycle low 18 months later.
That said, the broad market would begin to play catch-up from the vast under-performance it displayed during the first half of the decade. As such, the A-D Line would go on to set a new high just 3 months later, even as the S&P 500 failed to do so. So technically, the negative divergence was in place at the time of the September high in the S&P 500. However, retroactively, the A-D Line went to a new high for its cycle.
The question is whether or not that occurrence flies in the face of the flawless track record of a diverging A-D Line at cyclical market tops – or at least the spirit of the divergence. The other ponderable, or imponderable, is whether or not that episode will or may find a parallel in our present case. That is, is it possible that the S&P 500 fails to go to a new high despite the new high in the A-D Line? Would the divergence of last spring still count?
Unfortunately we do not have the answers in that regard. To the extent that 50 years of cyclical market topping history is relevant and meaningful, it still does not provide us with an answer as to our present circumstances. Yes, outside of the 1976 occurrence, we would say that given the new high in the A-D Line, the suggestion is that the S&P 500 has yet to make its cycle high. However, the 1976 top tells us it may not be that simple.
Then again, maybe we are reading too much into it altogether. It is one of the most reliable historical patterns related to cyclical market tops – yet, we have to have an open mind that events will not always conform to historical patterns. Furthermore, despite all the evidence, we cannot say for sure that a cyclical top is definitely in the works.
So what can we say? At a minimum, the new high in the A-D Line does breathe some new life into the broader stock market at a time when it was sorely in need of air. Thus, perhaps it buys the bovine a little more time, even if it is on its last legs.
_____________
More from Dana Lyons, JLFMI and My401kPro.
The commentary included in this blog is provided for informational purposes only. It does not constitute a recommendation to invest in any specific investment product or service. Proper due diligence should be performed before investing in any investment vehicle. There is a risk of loss involved in all investments.


