Is Breadth Signaling More Than Meets The Eye In This Market?

Does an unprecedented show of positive breadth foretell a quick end to stocks’ recent struggles?
One year ago, the emerging theme in the stock market was the failure of the stock market’s internals to keep pace with the advance in the major averages. This negative divergence would persist into the summer before reaching a head in late July. For us, it was easy to reach the conclusion that the internal deterioration had substantial negative implications for the broad market. This was based not only on intuition, but historical evidence as well. Now whether or not the long-term negative implications suggested by that internal deterioration come to pass is still to be determined.
However, I think it is reasonable to assume that this dynamic played a role in the weakness that unfolded over the subsequent 6 months.
Fast forward one year and we have the opposite situation…sort of. The breadth off of the mid-February low has been extraordinarily positive, even out-shining the advance in the large-cap averages. While this is a positive and bodes well for an eventual extension of the 2-month rally, we would not place its implications on par with last year’s situation. Last year saw a persistent negative divergence wherein many pieces of evidence accumulated into a great big storm cloud. Present circumstances are likely a positive factor on a smaller scale. Even so, the positive breadth again augurs for favorable market action, at least in the intermediate-term.
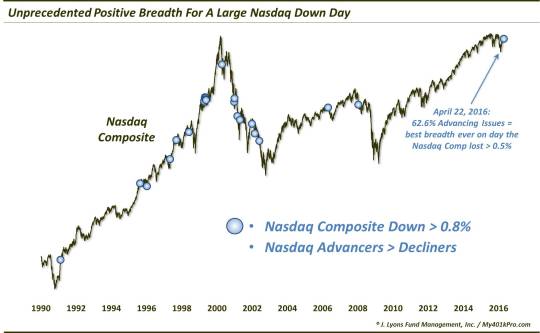
Then there are “one-offs” like we saw on Friday (April 22), i.e., unusual breadth occurrences that may or may not have implications for the near-term or longer. What happened on Friday? The Nasdaq 100 dropped almost 1.5% and the broader Nasdaq Composite fell 0.8%. Despite that, advancing stocks on the Nasdaq accounted for over 62% of all issues.
- That marked the most positively skewed breadth on any day in history (back to 1988) that the Nasdaq Composite lost at least 0.8%.
- Or, conversely, it marked the worst day ever for the Nasdaq Composite when advancing issues accounted for at least 60% of all stocks.
So is this just a bit of interesting trivia, devoid of larger meaning? Maybe, but let’s check out some similar historical precedents that may shed some light on what, if anything, we can expect going forward.
Obviously we have to relax our parameters a little given that Friday’s divergence was unprecedented. So first off, let’s look at all days the Nasdaq dropped at least 0.8% with more advancing issues than declining issues. Since 1988, there were 22 such days, before Friday.
Interestingly, Friday marked the first such occurrence since January 2008. Obviously, that date dispels the notion that our present case has to lead to positive longer-term performance. At the same time, however, there have been an equal number of dates occurring during cyclical bull and bear markets. So, perhaps any longer-term message can be dismissed.
As to the question of positive implications in the short or intermediate-term, those can essentially be dismissed as well – at least based on these historical precedents. Here is the performance of the Nasdaq in the aftermath of these dates.
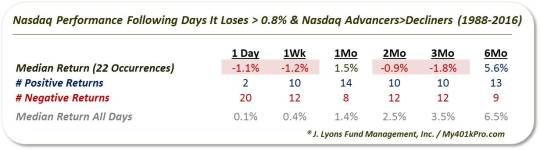
To the extent that there is any conclusion to be gleaned from these prior events, it is not a bullish one. The most consistent trend was for weakness the following day as 20 of the 22 days saw the Nasdaq lose ground – and at a staggering -1.1% median return. Today’s trading makes it 21 for 23 day-after losses.
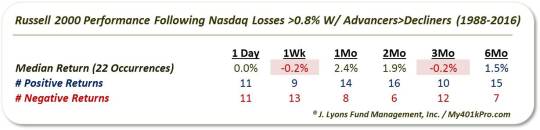
Things even out from there but still maintain a negative bias up to 3 months out. By 6 months, returns are almost back to normal. Now let’s take a look at the Russell 2000 as an (albeit imperfect) proxy for the broader, less top-heavy Nasdaq exchange. Returns following these days are a little bit brighter, but certainly nothing to get excited about.
What if we go from the other direction? That is, let’s look at all days when Nasdaq advancing issues accounted for at least 60% of all issues yet the Nasdaq Composite closed lower. Based on this criteria, we find 11 previous occurrences going back to 1988. The results? Outside of a tendency for gains 1 week later (the Nasdaq and Russell 2000 were up 9 of 11 times), the returns were so nondescript as to not even warrant presenting them.
So what’s the takeaway here? Studies of breadth thrusts
similar to what we’ve witnessed off of the mid-February low tend to argue for a further extension of the rally. That said, positive daily breadth divergences like we saw on Friday would not. At best, the evidence is too scarce to lend one to conclude anything. At worst, the evidence that does exist has actually leaned to the bearish side. However, even that has been mostly a toss-up after 1 day, which we’ve already had.
Therefore, if you are bearish, this data point won’t change your mind. On the other hand, if you are bullish, it is almost a certainty that the rationale for your position is more sound than any that can be concocted from this data.
_________
More from Dana Lyons, JLFMI and My401kPro.
The commentary included in this blog is provided for informational purposes only. It does not constitute a recommendation to invest in any specific investment product or service. Proper due diligence should be performed before investing in any investment vehicle. There is a risk of loss involved in all investments.


