Should Investors “Stay In May” This Year?

The old stock market adage “Sell in May and Go Away” has an impressive track record for a seasonality signal; but it may pay to ignore it this year.
Every year at this time, Wall Streeters trot out the familiar saying: “Sell in May, and Go Away.” Of course, this refers to the seasonal tendency of the stock market to out-perform from November through April, then languish during the 6 months between May and October. Indeed, on average, since 1900, the Dow Jones Industrial Average (DJIA) has gained 5.43% from November-April, but just 1.24% from May-October.
Like many Wall Street axioms, “Sell in May…” tends to elicit two strong, opposing reactions from market observers. One group places too much emphasis on the saying, blindly adhering to the strategy while forgetting that its track record results from an average of many decades worth of data points, some of which run directly contrary to the average. On the other hand, there is the group of cynics who dismiss the seasonal tendency out of hand as an over-simplified and arbitrary bit of data mining. This group erroneously overlooks the statistical consistency and significance of the “Sell in May…” track record, both here and in many other markets abroad. Thus, we try to take a measured approach, respectful of its track record but not over-reliant on its obligation to pan out each and every year.
Speaking of not panning out, we have found a subset within “Sell In May…” that has actually seen the phenomenon perform in a manner opposite that of the overall tendency. This subset involves another seasonal pattern: the Presidential Cycle. We won’t go into detail on this cycle but it refers to the tendency of the market to behave in a particular fashion depending upon its location within the 4-year Presidential Election Cycle.
Regardless of the rationale behind the Cycle, we have found that one particular year has seen the “Sell In May…” pattern perform contrary to its regular tendency. As our Chart Of The Day reveals, that would be Year 4, or the election year, of the Presidential Cycle…i.e., this year.
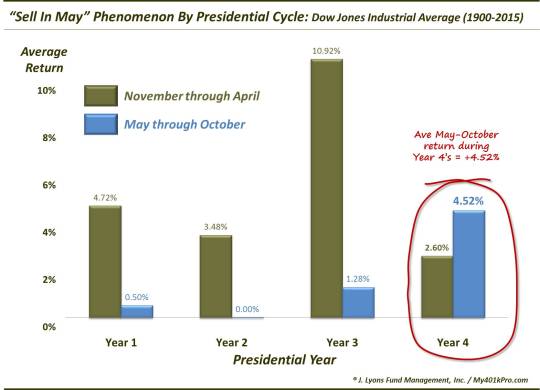
As the chart shows, the two 6-month periods within Year 4′s have, on average, seen the market go the opposite way of the traditional “Sell In May…” pattern. The November-April period (which ends today) has seen the DJIA gain just 2.60%, on average, since 1900. Meanwhile, the DJIA has enjoyed a 4.52% average return during the May-October period during election years.
While we have our suspicions about why this reversal in the pattern has occurred during election years, we’ll leave that to the story-tellers to debate. All we really care about is what is happening. And based on history, investors may have a bit more incentive to hang onto their stocks this summer than normal.
_____________
More from Dana Lyons, JLFMI and My401kPro.
The commentary included in this blog is provided for informational purposes only. It does not constitute a recommendation to invest in any specific investment product or service. Proper due diligence should be performed before investing in any investment vehicle. There is a risk of loss involved in all investments.


