Small Caps Trying To Overcome Big Hurdle

The Russell 2000 small cap index is testing a key level of resistance stemming from the 2009 lows.
In our view, the biggest development in the equity markets over the past 2 weeks, in addition to and related to the leadership rotation, has been the ability of previously lagging areas to overcome significant resistance levels on their respective charts. Today’s Chart Of The Day reveals yet another challenge – or is it an opportunity? – in a former laggard, small caps. Specifically, it is developing on the chart of the popular Russell 2000 Small Cap Index.
The Russell 2000 (RUT) was one of the canaries in the stock market coal mine a year ago. After topping in June, it began to lag the large caps significantly. And after failing to approach new highs last July, it led the stock market lower during the August-September rout. Similarly, after a relatively meager bounce last fall, the RUT again led the market lower into the February lows.
Based on its post-February bounce, however, we cannot include it in the category with the other laggards that have just begun to emerge. Though it certainly started from a more extreme “oversold” level, the RUT has still been one of the more robust and consistent performers since the February low. As of today, the index is up slightly over 20% from those lows. And every time the index has been faced with apparent resistance on its chart, it has been up to the challenge.
The RUT’s stiffest challenge yet, however, may be facing it presently in the form of the underside of the Up trendline stemming from the 2009 lows.
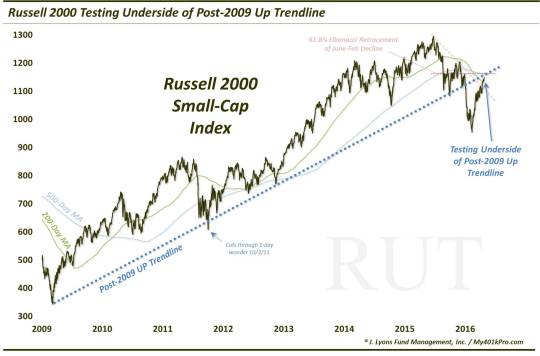
You’ll notice on the chart that the post-2009 trendline connects the lows from March 2009, September 2011, November 2012, September 2015 and December 2015. You’ll also notice that it slices through one date – October 3, 2011.
While some folks may object to this trendline “violation”, we are not opposed to such practice in certain instances, especially when it is a single out-lying day. Trendlines are a subjective tool and their connection points do not always line up precisely. However, our view is that the point is to find the line that most accurately represents the trend, delineating support when price is above and resistance when below. That is why it is called a TREND-line.
Anyway, on January 6, the Russell 2000 broke down below the trendline, leading to an immediate 12% drop over the next 10 days. Since its eventual February low, however, the RUT has out-performed much of the market, again gaining more than 20%. Along the way, it has been able to surmount any and all resistance in its path. This includes last Monday’s hurdle of both the post-June Down trendline and the 200-day moving average, both shown on the chart. This marked the 1st time in exactly 8 months – as the August collapse was commencing – that the RUT traded above the 200-day MA.
You’ll also notice a few other resistance points of interest on the chart, including the 500-day moving average and the 61.8% Fibonacci Retracement of the June-February decline. Both those lines of consequence sit just above the 1160 level and should not be dismissed as potential resistance.
However, the piece de resistance (sorry) is the post-2009 Up trendline that is now limiting the trajectory of the RUT. In fact, today marks the 6th straight day in which the index was rejected by the trendline. The line currently sits somewhere between 1148-1150. The Russell 2000 closed today at 1150.73 so it is making an unmistakable run at recovering the trendline.
Now, we never want to anticipate a breakout, so it remains resistance until it’s not. However, considering all of the other levels that the RUT has overcome, as well as all of the other key indexes that have surmounted similar lines of resistance, one certainly has to have an open mind about the potential for the Russell 2000 to recapture the trendline.
So will the post-2009 Up trendline continue to be resistance, or is it simply providing another opportunity for the index to hurdle over and accelerate its run? We don’t know what will happen, but feel pretty confident about the significance of the trendline. Either way, it could provide both bulls and bears with a (trend)line in the sand to trade against.
________
More from Dana Lyons, JLFMI and My401kPro.
The commentary included in this blog is provided for informational purposes only. It does not constitute a recommendation to invest in any specific investment product or service. Proper due diligence should be performed before investing in any investment vehicle. There is a risk of loss involved in all investments.


