12 Months Of “Close But No Cigar” In The Stock Market

While it’s now been a year since the Dow’s last 52-week high, it has actually remained almost record-breakingly close to that high for the past 12 months.
This is more or less a commemorative post, with a bit of “did you know” trivia that we aren’t afraid to throw out. May 19 marks the 1-year anniversary of the Dow Jones Industrial Average’s (DJIA) last 52-week (and all-time) high. Remarkably, this is the first time since October 2009 that the index has gone 12 months without a new high. Despite the inability of the index, however, to attain a new high during that time, it has remained relatively close to its former high – in fact, almost unprecedentedly close.
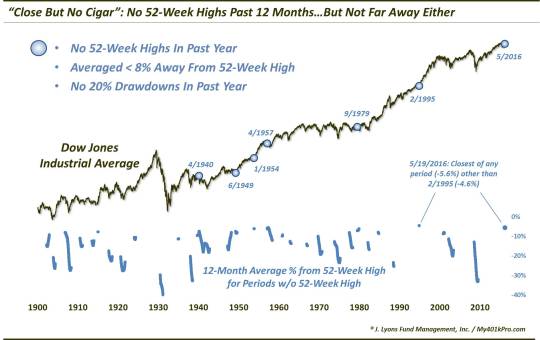
If you’re thinking that the past year has been relatively flat for the stock market (outside of a few temporary scares), you’re instincts are correct. Over the past 12 months, the DJIA’s average distance from its 52-week high, on a daily closing basis, is 5.6%. Since 1900, there have been now 33 unique periods (encompassing 5840 days) when the DJIA went 1 year without a 52-week high. 5.6% is the 2nd closest average of all such periods during that time. Only the beginning of February 1995 saw the DJIA remain closer (4.6%) to its high, on average, over the preceding 12 months, without scoring a new high. The average average distance of all 5840 days is 19.4%, and the median is 15.4%.
Now, we are not ones for using this space to post gratuitous market trivia. Frankly, while we enjoy some good trivia as much as the next person, we’ve not the time to pursue such efforts without the hopes of receiving some value or benefit from the research. Therefore, we at least took a cursosry look at other historical periods bearing some resemblance to the DJIA’s past 12 months of “close but no cigar”. What we searched for were periods meeting the following criteria:
- A full year without a 52-week high
- A 12-month average of less than 8% away from the 52-week high
- No drawdowns in the past 12 months of 20% or more
We thought this criteria reasonably met the label of a flat market that was nonetheless unable to attain a new high (if you think the 20% drawdown bar is too low, the average drawdown of 12-month periods without a new high has been -31.9%). What did we learn about the 6 prior periods meeting our criteria that might be helpful to our current circumstances? Probably a whole lot of nuthin.
The environments marking these 6 periods ran the gamut from mid-late secular bear market to early-mid-late secular bull market. And the aftermath of these occurrences are hardly helpful in deciphering the meaning, if any, of our present circumstances. Consider the aftermath of the prior dates:
- April 1940 – The DJIA dropped 23% over the next month and 34% over the next 2 years
- June 1949 – The DJIA jumped 20% over the next 6 months and 51% over the next 2 years
- January 1954 – The DJIA jumped 20% over the next 6 months and 70% over the next 2 years
- April 1957 – The DJIA dropped 8% over the next year
- September 1979 – The DJIA dropped 7% over the next 6 months and 3% over the next 2 years
- February 1995 – The DJIA jumped 40% over the next year and 73% over the next 2 years
Detect the trend? Neither do we.
Sometimes historical research can be extremely instructive as to expectations on present circumstances. Sometimes it is merely random trivia. This instance falls into the latter category.
Thus, while there very well may be a message and meaning to the past 12 months of the DJIA staying within striking distance of, but not quite at, a new 52-week high, not much is to be gleaned from apparent historical precedents. Thus, in attempting to decipher the message, one will likely be best served in focusing on contemporary data and indicators.
________
More from Dana Lyons, JLFMI and My401kPro.
The commentary included in this blog is provided for informational purposes only. It does not constitute a recommendation to invest in any specific investment product or service. Proper due diligence should be performed before investing in any investment vehicle. There is a risk of loss involved in all investments.


