A High-ly Unusual Breadth Milestone

The number of 52-Week Highs on the NYSE itself made a 52-week high, even as the market averages were falling; this is a rare feat, with surprising previous results.
As a firm, our equity investment process places a significant weight on market breadth and this year has been interesting in that regard. On the one hand, we entered 2016 with historically lagging breadth. On the other hand, the breadth associated with the post-February rally in stocks has been very good. Mixed in along the way have been a number of breadth anomalies, whether good, bad or just weird. Today’s Chart Of The Day might best belong in that latter category.
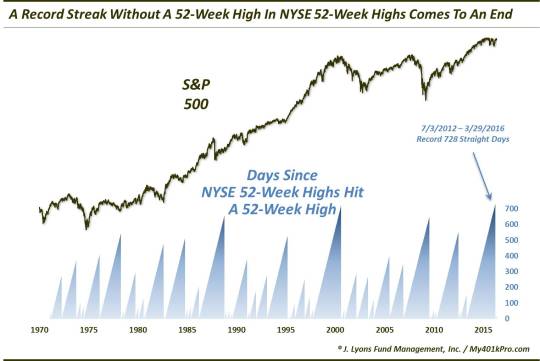
Despite the recent multi-year stock market rally, the number of new 52-week highs on the NYSE has been in a steady decline since topping in early 2013. In fact, we noted in a post almost exactly 1 year ago that, at the time, the market had gone 500 days without the number of NYSE 52-Week Highs itself hitting a 52-week high. That was just the 8th such streak since 1970. Amazingly, the streak would continue for another 10 months until NYSE New Highs finally hit a 52-week high on March 29. The total tally of 728 consecutive days marked a new record going back to 1970.
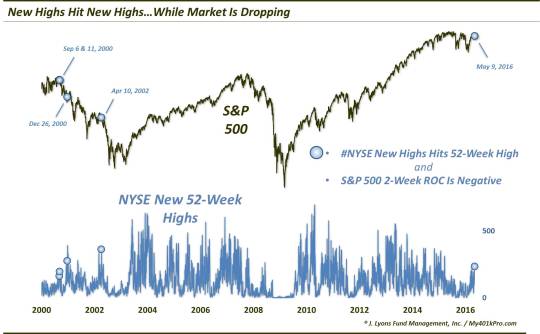
Believe it or not, however, that’s not the strangest development, in our view. On Monday, May 9, NYSE New Highs recorded another 52-week high. What was unusual about it was that the stock averages were in the midst of a multi-week selloff. In fact, of the 116 days since 1970 that the NYSE New Highs hit a 52-week high, this marked just the 4th time the NYSE was showing a negative 9-day rate of change – and a record worst -2.20% at that.
As far as the S&P 500 is concerned, it was just the 5th time the index had a negative 2-week rate of change on those days, as shown here.
So what are we to make of this phenomenon? First off, followers have pointed out to us (as they always do) the likely impact that bond-related funds may be having on the data. These issues have been around for some time, however, and while they obviously have some impact on the data, we have never found them to be prohibitive in analyzing breadth data. That is, the historical behavior has been very similar with or without including the bond funds.
Secondly, as we put a lot of weight into breadth statistics when analyzing the markets, we would instinctively assume that this was a positive development, considering the out-performance by the broader universe of stocks. However, looking back at similar days historically, that would seemingly be a dangerous assumption.
As the chart above shows, the previous 4 occurrences regarding the S&P 500 all took place during the 2000-2002 bear market. Needless to say, stock performance following these events was atrocious.
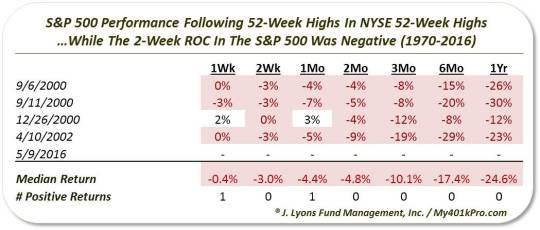
That performance puts a quick end to our bullish assumptions.
Now we will add that there were other dates that would have been included here had we used a different rate of change period.(e.g., 5-day, 7-day, etc.). Some such events include dates in October 1988, May 2003 and April 2010. The common thread here is that the market was rallying off of deeply oversold breadth readings associated with the preceding cyclical bear markets. Thus, the 52-week high in New Highs occurred almost by default, as a result of extremely easy comparisons over the prior 52 weeks. And while the Flash Crash did occur soon after the 2010 occurrence, the longer-term returns following that event, and all periods following the others were extremely positive.
So what is our takeaway here? The circumstances surrounding our present case do not seem to match up well with the “near-misses” just mentioned. Thus, we’d have a tough time spinning this development as a positive. Perhaps the best comparison would be the 2000 case. Even so, no markets are identical so we wouldn’t place too much confidence in the idea that the market will follow in the footsteps of the 2000 event. Finally, and importantly, we are only dealing with a handful of events in 45 years. Thus, any conclusion based on this study would have a tough time passing statistical muster.
Therefore, our most valuable takeaway is simply the fact that what seemed like a development with bullish ramifications, is not necessarily so when looking at prior precedents. Outside of that, this milestone seems to best fall under the strange-but-true category – the market equivalent of “what you talkin’ bout, Willis?!”
_____________
More from Dana Lyons, JLFMI and My401kPro.
The commentary included in this blog is provided for informational purposes only. It does not constitute a recommendation to invest in any specific investment product or service. Proper due diligence should be performed before investing in any investment vehicle. There is a risk of loss involved in all investments.


