Can Momo Regain Its Mojo?

High beta stocks were among those laggards that broke out above resistance last month, providing more fuel for the rally; they are now testing that breakout level.
We last wrote about high beta, or momentum, stocks on April 7. After a solid bounce off of the February lows, the group – as represented by the PowerShares S&P 500 High Beta ETF, ticker SPHB – had reached a level containing multiple noteworthy lines of resistance. The reaction at this level, we argued, could be an important tell for the further prospects of the broad post-February rally:
“One development that would go a long way toward the “merely a pause” scenario, would be a breakthrough of resistance levels among some of the more beaten-down and speculative areas of the market. Such a development would suggest the potential of a rotation of new leadership from the more defensive areas to the more “risk-on” areas of the market. This could give the rally the jolt of energy needed to propel it on to a new, durable leg of advance.”
The point of our April 7 post was that the high beta group failed convincingly in its initial test of the aforementioned resistance. However, we went on to say that this failure:
“…does not necessarily spell the end of the line for high beta stocks or the post-February stock market rally, in general. Perhaps they will get a dose of “risk-on” cortisone yet that will propel these stocks to new rally highs above the listed resistance.”
Indeed, just a week later, high beta stocks, along with a host of other laggard groups had pulled a u-turn and broke above the former lines of resistance. This brought an immediate jolt to the market, lifting stocks to new rally highs over the next few weeks.
In the longer-term, however, this breakout among the laggards, like high beta, is obviously only meaningful if it can be sustained. Of concern, we have seen a few examples among these groups, e.g., Germany, that appear to be failing to hold their breakout levels. Many others are now coming down to “test” those breakout levels of former resistance to see if they will now serve as support. This includes the high beta SPHB.
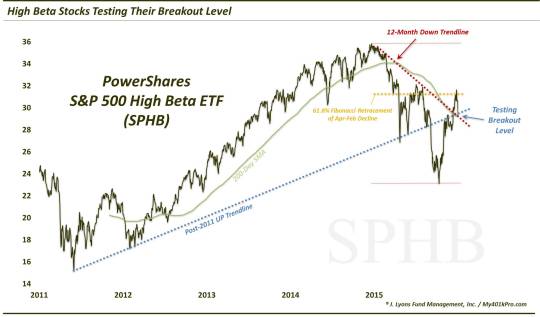
As the chart indicates, lines of consequence at present levels near 29 include the:
- Post-2011 UP Trendline
- 12-Month Down Trendline
- 200-Day Simple Moving Average
- 50-Day Simple Moving Average
As we mentioned in the April post:
“If the post-February rally is to include another leg higher, it would be a great help if these higher beta areas would step up and pull their weight.“
For high beta to pull its weight, the first order of business is to successfully hold last month’s breakout area. This is a common theme among many of the former laggards that experienced promising breakouts last month.
Thus, while this may seem like a rather innocuous Chart Of The Day, this development is fairly widespread. Therefore, we do not think we are overstating things by saying that the longer-term potential of the post-February rally may very well depend on the outcome of these tests across the market.
A failure here could suggest the end of the line for the rally as the high beta, etc. areas that appeared ready to fuel another leg up in the rally proved to be out of gas. On the other hand, a successful test and hold here may enable these sectors to regain their mojo and lead another risk-on advance in stocks.
__________
More from Dana Lyons, JLFMI and My401kPro.
The commentary included in this blog is provided for informational purposes only. It does not constitute a recommendation to invest in any specific investment product or service. Proper due diligence should be performed before investing in any investment vehicle. There is a risk of loss involved in all investments.


