Just Your “Average” Stock Pullback?

An index measuring the performance of the “average” stock in the market bounced precisely at a key support level.
We dedicated several posts last week on the fact that many indices, market-wide, demonstrated successful tests of key support in recent days. This goes for many of the previous laggards that we’ve alluded to several times, whose April breakouts provided new fuel for the post-February bull market. It wasn’t just this new fuel that bounced where it “needed to”, however. Several broad market examples also successfully bounced off of key support. Included in that category is the Value Line Arithmetic Index (VLA).
We’ve mentioned the VLA, and its sister index, the Value Line Geometric Composite
(VLG), many times in this space. We are big proponents of “breadth” as a major input in driving our investment orientation. The broader the participation among stocks in a rally, the more bullish we are. The reason we like the Value Line indices is because they are unweighted averages of a universe of approximately 1800 stocks. Thus, they provide an instructive gauge of the health of the broad stock market. Specifically, the VLG measures the median stock performance among the universe and the VLA measures the average.
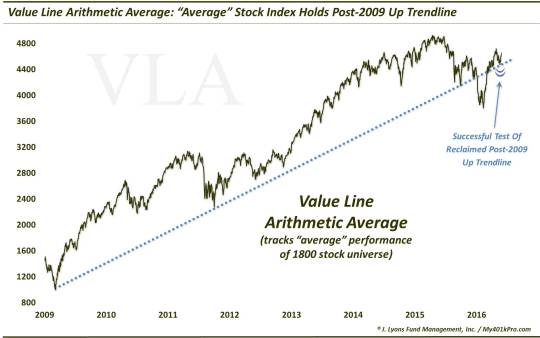
It is the average Value Line Arithmetic Index that we are looking in today’s Chart Of The Day. Like the aforementioned posts, the VLA bounced off of key support last week, most notably the reclaimed post-2009 Up trendline.

The VLA had previously broken below the post-2009 trendline (connecting the 2009, 2011 and September 2015 lows) on January 6, leading to an immediate 10%+ plunge. Following the February lows, however, the VLA went on a blistering rally, recovering the trendline by early March. And in its biggest test yet of the reclaimed trendline, the VLA passed with flying colors, bouncing some 5% off of a precise touch of the line 6 days ago.
One indication of a strong uptrend is when an index bounces where it “should”. That implies that sufficient demand (i.e., buyers) is waiting upon pullbacks. Another indication of a strong uptrend is when pullbacks are relatively shallow. One way we like to measure the depth of a pullback is in Fibonacci terms. Fibonacci Retracement levels represent a sequence of percentages that often (not always) guide the depth of countertrend moves in a price series. The shallowest significant Fibonacci Retracement that we watch is the 23.6%.
In the case of the VLA, the pullback from the April high to the May low marked an almost precise 23.6% retracement of the February to April rally. Again, the willingness of buyers to step in so quickly is a bullish sign. Sure, the index could collapse tomorrow and everyone would be pointing at the lower high on the chart. However, up til now, the VLA’s post-February uptrend has done little wrong.
The developments surrounding the VLA will continue to bear monitoring. Maintaining the post-2009 Up trendline will be an especially important task for the index. Doing so means the broad market is maintaining its upward trajectory. Thus, at least in this case, average strength is a good thing.
________
More from Dana Lyons, JLFMI and My401kPro.
The commentary included in this blog is provided for informational purposes only. It does not constitute a recommendation to invest in any specific investment product or service. Proper due diligence should be performed before investing in any investment vehicle. There is a risk of loss involved in all investments.


