Not Your Average Save For Stocks This Week

An index that tracks the “average” stock performance made a remarkable recovery following an intra-week break of it bull market trendline.
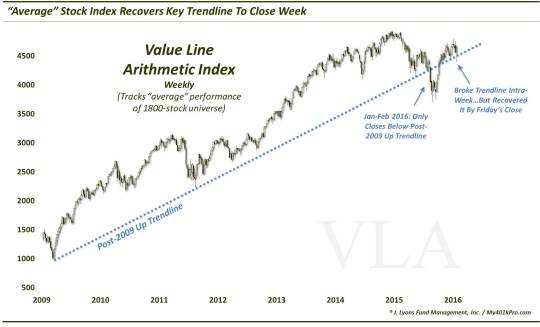
We wrap up Trendline Week with perhaps the most significant trendline development of the week. It highlights an index that broke its major bull market trendline during the early-week Brexit hangover, only to recover it, demonstrably, by week’s end. It certainly was not the only index or security to accomplish this feat; however, considering the importance of the index – and the trendline – it was one of the most significant saves of the week. The index in question is the Value Line Arithmetic Index (VLA).
The VLA is one of our favorite market measuring sticks as it tracks the average performance of a universe of roughly 1800 stocks. Thus, it is a good barometer of the health of the broad market of stocks as it indicates the direction stocks are headed on average. Additionally, though there is no actual money traded off of the indes, it conforms very well to technical and charting analysis.
As such, the VLA has been supported by an up-sloping trendline since the beginning of its bull market in 2009. The trendline saw bounces off of it at the lows in 2011 and September 2015. After a brief hold in December of last year, the trendline finally gave way in January, leading to the rout to begin the year. However, after spending nearly all of January and February below the trendline, the index recovered the top of the trendline at the beginning of March. And while most folks may not consider it, trendlines can still be relevant even after they’ve been broken.
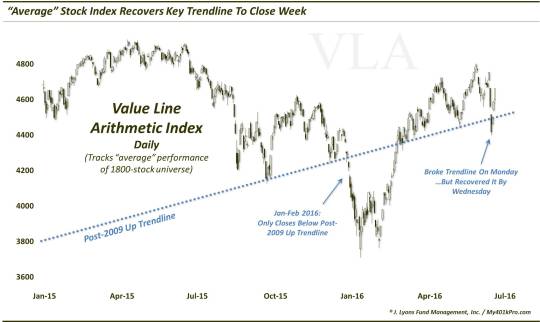
We see that in this instance with the VLA. After recovering its post-2009 trendline, we see the trendline serving as support once again with the index bouncing off of it numerous times in March, April and May. On Monday, in the Brexit aftermath, the VLA finally gave way again, breaking below the trendline. Considering what happened the last time the trendline broke, we obviously considered this a negative development for the broad stock market as it left it apparently vulnerable to even more substantial losses.
That did not transpire, however, as the VLA, along with most areas of the market, staged an inspiring rally to finish the week – and recover the trendline once again (as shown here in this weekly chart back to 2009).
Here is a closer-up, daily, look at the VLA’s action around the trendline over the past 18 months.
We are not going to belabor the point about the trendline as it is self-evident. Frankly, there are enough cross-currents in the market right now – good and bad – that we can envision a sizable move in either direction. Therefore, as risk managers, we are certainly open to all scenarios. The one variable that obviously matters most is price. While it is not necesarilly predictive like other metrics can be, price is the final arbiter, the truth (even if it may tell a temporary fib).
That’s why we view this trendline save – and similar ones vis-a-vis the other markets we looked at this week – as so critical. In this environment, in which we can envision out-sized moves in either direction (both happened in the past week, for heaven’s sake), it is critical for bulls and bears alike to have price on their side of the field.
For now, these trendlines may be as good a boundary as anything in determining who has the ball. And while the bears may have had possession to start the week, the bulls have stolen it back once again.
________
More from Dana Lyons, JLFMI and My401kPro.
The commentary included in this blog is provided for informational purposes only. It does not constitute a recommendation to invest in any specific investment product or service. Proper due diligence should be performed before investing in any investment vehicle. There is a risk of loss involved in all investments.


