Stocks’ Streak Of New Highs Hits Rarefied Air

The Dow just scored 7 straight all-time highs; are there more on the way, or is the air getting too thin?
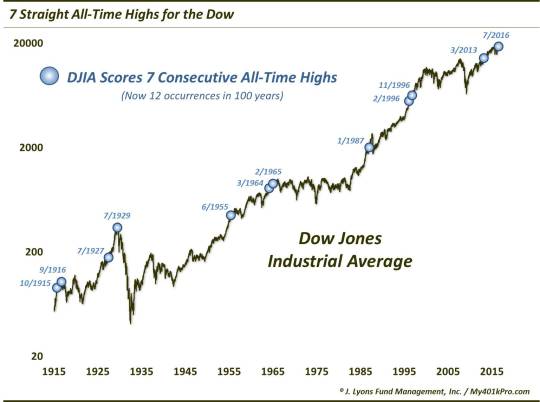
When the major U.S. stock averages broke out to new highs earlier this month, the key consideration became would the breakout fail or would the new highs stick? Well, 10 days later the breakout gets high marks for follow through. This is particularly so in the case of the Dow Jones Industrial Average (DJIA). As many averages have spent the past several days digesting recent gains, the DJIA has continued its ascent. In the process, the index has recorded 7 straight all-time highs.
While the streak is not unprecedented, it is just the 12th such run in the past 100 years.

With the understanding that all periods are unique and circumstances are never exactly the same, we looked at the prior streaks to see if there were any general patterns that followed. Additionally, this set of criteria is very specific and does not capture all of the similar precedents that may alter just slightly from this setup (i.e., 6 straight all-time highs or 8 out of 9 days hitting all-time highs, etc.). That said, here are some aggregate performance statistics for the DJIA following the previous 7-day streaks of all-time highs.

First off, 7 of the 11 went on to an 8th straight all-time high while 4 of the streaks ended at 7. It looks like today will probably tighten up the score at 7-5 with the DJIA down over 100 points late in the trading day. Along those lines, the ratio was the same – 7 winners and 4 losers – out to 2 weeks (not shown). So, in the immediate-term, there was a slight propensity for gains to continue but nothing overwhelmingly positive.
By 3 weeks, though, 10 of the 11 showed further gains, with a median return of +1.4%, double the median return after all days. That strong follow through tended to persist out to 2 months as well where 9 of the events were positive and the median return was +4.4%, almost 3 times the normal +1.6% return. On top of that, the median 2-month drawdown was a mere -0.7%. So the risk/return relationship was a favorable one out to 2 months, based on these historical precedents.
That is probably as far as we would apply any positive expectations, however, as the +4.4% median return is as good as it got out to at least 6 months. Returns out to 2 years ranged anywhere from slightly better than average to slightly worse. And while the drawdowns did not skyrocket after 2 months, they did commence a gradual ascent.
Perhaps the most notable takeaway from performance following prior streaks is that – there’s not much that’s notable. The 2-month performance is very solid, but outside of that, returns are fairly mundane. That being the case, we would have to give the nod to the bulls as it pertains to the study here. 7 days into new all-time highs, the status quo, or at least mundane action from here, would not be the end of the world for them.
Then again, there were occurrences in the lead-up to (though, not directly before) the crashes of 1929 and 1987 as well as the secular top of 1966. So, in the words of Shoeless Joe Jackson in Field of Dreams, “look for a pitch low and away…but watch out for in your ear.”
_____________
More from Dana Lyons, JLFMI and My401kPro.
The commentary included in this blog is provided for informational purposes only. It does not constitute a recommendation to invest in any specific investment product or service. Proper due diligence should be performed before investing in any investment vehicle. There is a risk of loss involved in all investments.


