Vice Tightens Further On Historic Stock Market Range

What does the S&P 500′s 2nd tightest 2-week trading range ever have in store for stocks?
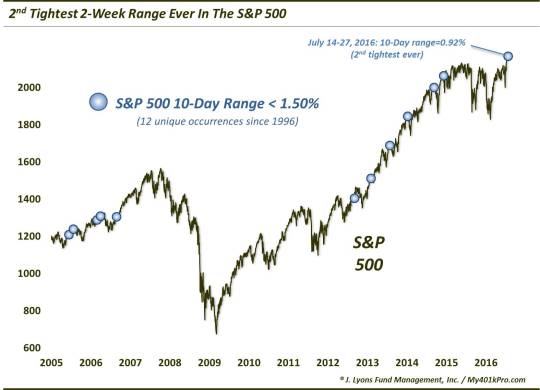
We’ve written quite a bit about the stock market’s present tight trading range. In fact, we didn’t plan to cover it any further, except – it continues to persist. So while we thought it redundant to bring it up again, now that we are 2 full weeks into the trading range, it may be worth one more mention. It is particularly noteworthy considering the fact that, after today’s trading, the S&P 500 is exhibiting its 2nd tightest 10-day trading range ever. Not only that but, at 0.92%, its 10-day range is less than 1% for just the 3rd time ever.
For those wondering, 8/6/1993 and 1/24/1994 were the only other 2 dates showing a 10-day range of less than 1% in the S&P 500. Those dates should not surprise anyone familiar with that era. The mid-1990′s represented one of the least volatile periods in market history. In fact, of the 26 days showing a 10-day trading range in the S&P 500 of less than 1.3%, 24 occurred between 1993 and 1995. Only 9/8/2014 and today occurred outside of that period.
Because of that unique period, we are hesitant to compare tight ranges from then with the present one. Not only was it a different point in the overall market cycle but the volatility regime was much different. While we are presently seeing very low volatility readings, it has not been that way for several years like it was during the mid-1990′s. In fact, here is a great illustration of that point – and great context with which to compare the present range. While the past 10 days have shown a cumulative trading range of less than 1%, there was a point this past January and February when no less than 29 straight days had ranges of over 1%.
Therefore, because of the unique volatility regime in the mid-1990′s, we find it perhaps more useful to review comparable trading ranges from more recent years. Specifically, we looked at the prior occasions since 1997 that saw the S&P 500 trade in a range of less than 1.50% over a 2-week period. As it happens, there have been 11 such prior tight ranges since 1997, all occurring since 2005.
Of course, everyone wants to know what happens to stocks following these ranges. It has been suggested – and often observed by us – that tight ranges are followed by out-sized moves. But as we mentioned in last Friday’s post, it depends what kind of market environment we are in. During those mid-1990′s, for example, tight trading ranges were often followed up by…further tight ranges. However, during more “normal” periods of alternating volatility, like today, the ranges may lead to larger than typical moves.
So is that notion borne out by the S&P 500′s performance following the more recent 11 tight ranges shown in the chart above? And while it is a small sample size, is there any clue as to the direction of the market upon a break out of the range? Well, we hate to be anti-climactic but the S&P 500′s performance following those 11 events is nearly indistinguishable from the performance following all days since 1950:
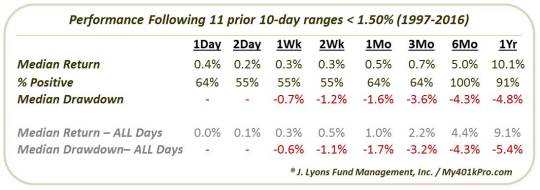
We’re not going to belabor any points regarding this table. Again, they results are, for the most part, very much in line with all days. The only standout occurs at the 6-month point when all 11 are positive. Even still, the median return is hardly any better than that after all days.
One last comment. It isn’t shown on the table, but one may notice it on the chart above. If you look carefully at the last 4 occurrences (prior to this one), it appears that each of them ran into some trouble almost immediately. Indeed, following tight ranges on 7/31/2013, 1/10/2014, 9/11/2014 and 12/8/2014, the S&P 500 experienced 1-month drawdowns of -3.3%, -5.5%, -4.6% and -4.3% respectively. Therefore, if there is something to the notion that more recent precedents are the most relevant to present circumstances, this tight range may be a bit of a red flag in the near-term.
(Btw, if you’re wondering – like we usually do – about the performance following these tight ranges when the S&P 500 is trading close to a 52-week high, don’t bother. As it turns out, these ranges occur almost exclusively near highs. For example, since January 1995, all 42 days showing a 10-day range of < 1.50% occurred within 3% of a 52-week high.)
While we pride ourselves on delivering daily charts and posts that are both original and carry at least some measure of value in terms of aiding one’s investment decision making process, occasionally the subject matter is more of the trivial nature. That may be the case here. While the more recent precedents akin to our current situation would suggest some caution here, there is really nothing statistically significant to lean on here.
However, it doesn’t mean it was a useless study since we did not know beforehand that the results would be so mundane. Besides, any time we see the the venerable S&P 500 flash a 2nd biggest, smallest, tightest, etc. anything, it makes for compelling research.
_____________
More from Dana Lyons, JLFMI and My401kPro.
The commentary included in this blog is provided for informational purposes only. It does not constitute a recommendation to invest in any specific investment product or service. Proper due diligence should be performed before investing in any investment vehicle. There is a risk of loss involved in all investments.

