No Complacency Among These Equity Options Traders

Unlike many of the sentiment indicators we’ve looked at recently, traders on one options exchange recently exhibited a record show of nervousness.
We’ve written a fair amount recently about the growing level of optimism, or complacency, evident in many corners of the stock market. Indeed, overly exuberant sentiment is probably the most troublesome factor in the markets right now. There is nary a time, however, when all signals and indicators are in alignment with one another. The present is no exception. And in fact, the traders on one options exchange recently demonstrated a record level of cautiousness.
We have covered options ratios from the International Securities Exchange (ISE) on numerous occasions in the past. While it does not clear the level of volume seen on other exchanges, the ISE data can still be quite useful as a measure of trader sentiment. Part of its effectiveness stems from the fact that the ISE only includes opening customer long positions (calls or puts) in its ratio calculations. This practice, argues the ISE, makes for a more accurate gauge of investor sentiment than when incorporating more complicated trades by large firms and market makers as well.
Typically, we prefer to look at the ISEE, “ISE Equity”, call/put ratio for a read on sentiment out of the exchange (unlike most sources, the ISE lists their options ratios with calls as the numerator and puts as the denominator). Today’s Chart Of The Day, however, looks at the ISE “All Securities” ratio. This includes index and ETF options trades as well. The reason for highlighting this ratio today is that on Tuesday, August 23, it registered its lowest reading ever recorded, 31, since inception in 2002. In other words, just 31 calls were bought for every 100 puts.
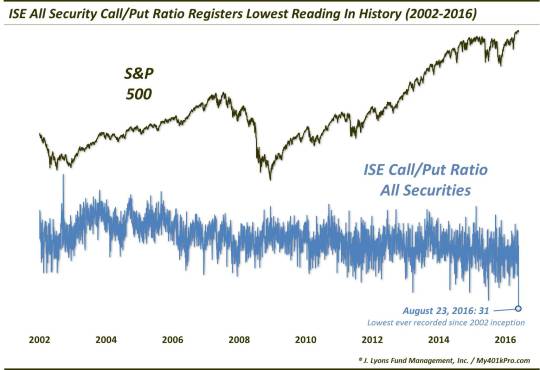
Obviously, this contradicts the complacency theme we’ve been documenting recently. This shows an elevated – and in fact, record – degree of caution on the part of these traders.
Looking historically at other extreme low readings, we find that most of them came near at least short-term market lows. For example, since inception, there have been just 9 other readings below 50. All of them have occurred since 2013, incidentally. That is not too surprising as the chart indicates a downward sloping trend since 2003. Whether this is related to a sentiment trend or something structural, we can’t say. However, even based on recent history, and even on a normalized basis, the August 23 reading was the lowest ever recorded.
So looking at the readings below 50, what can we glean, if anything?
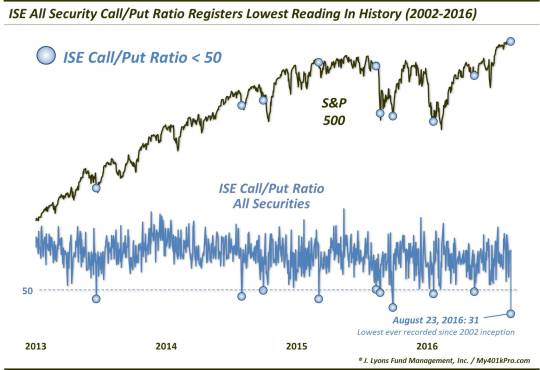
Again, as the chart shows, most of the readings occurred after at least a short-term selloff. They also marked almost the precise short-term bottom in the S&P 500 at many of the readings. Therefore, the performance of the index was generally very positive going forward. However, it is not all bull fodder, as the following table of previous incidents demonstrates:
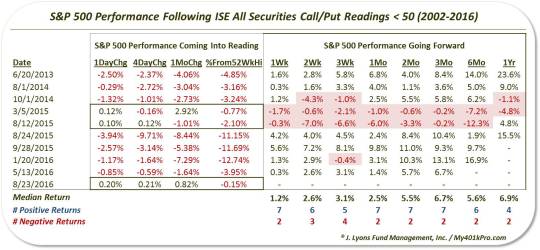
As the table indicates, the median performance and consistency of positive performance was very good after prior readings below 50. 7 of the 9 instances were positive after 1 week, and after 1-3 months.
However, it is the 2 failed readings, and their similarity to current circumstances, that gives us pause in assuming an all-clear sign. Unlike the other events, those 2 failures, on 3/5/2015 and 8/12/2015, occurred in the absence of any noteworthy weakness. In fact, they were the only 2 prior readings that occurred while the S&P 500 was positive over either the previous 1 day, 4 days or 1 month. They were also the only 2 occurring with the S&P 500 within about 2% of its 52-week high.
At least they were the only 2 prior to the current reading. As of Tuesday, the S&P 500 was positive over the prior 1 day, 4 days and 1 month. It was also within a hair of a 52-week high. This similarity to those prior failed readings is cause for concern and a genuine reason to distrust, if not dismiss, the present reading.
So while this indicator is one of the few sentiment measures not showing a high degree of complacency of late, it may not be as positive a sign as one would think at face value. Given the similar conditions presently to previous readings that failed, we’d have a hard time putting this into the bullish column. For, although these traders are far from complacent currently, perhaps their caution is well-founded.
_____________
More from Dana Lyons, JLFMI and My401kPro.
The commentary included in this blog is provided for informational purposes only. It does not constitute a recommendation to invest in any specific investment product or service. Proper due diligence should be performed before investing in any investment vehicle. There is a risk of loss involved in all investments.


