Stock Market Levitation Hits Historic Heights
The S&P 500 is on a rare streak of closes near a 52-week high; can this bull run continue or will gravity take over?
The recent, and ongoing, historically tight range in the stock market has been well documented. Over a month ago, we mentioned that the S&P 500 traded in its smallest 2-week range in history. A month later, the index has incredibly barely seen an expansion of that range. One aspect of this recent action that we detected, however, may be even more astonishing. It deals with the S&P 500′s streak of closing near a 52-week high. Specifically, every close since July 8 has been within 1% of a 52-week high. That streak of 39 days is the 2nd longest in the past 50 years.
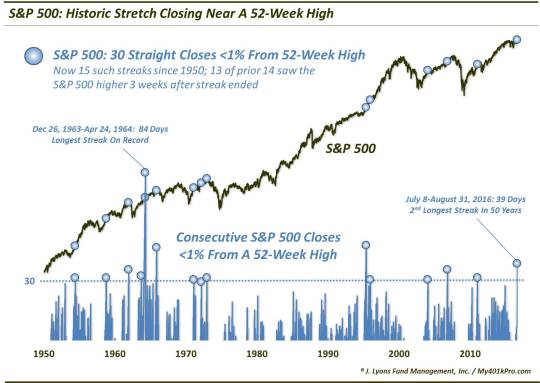
Since 1950, this is just the 15th streak of 30 days or more closing with 1% of a 52-week high. The all-time record lasted an astonishing 84 days, from December 26, 1963 to April 24, 1964. The only streak longer than our current one since 1965 took place from March-May 1995, spanning 48 days. Here are all the streaks and their ultimate length in days:
6/7/1954 32
10/14/1958 32
12/15/1961 36
9/25/1963 33
4/24/1964 84
11/19/1965 47
2/17/1971 31
3/10/1972 30
12/15/1972 32
5/17/1995 48
12/15/1995 31
1/27/2004 31
10/31/2006 36
1/18/2011 32
If you are wondering what the S&P 500 has done following these streaks, there has generally been an initial jolt, followed by a resumption of the uptrend – at least in the near-term.
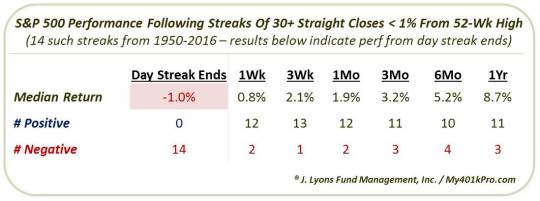
As the table shows, the streaks have typically ended with a bang with the median return on that day of -1.0%. After that initial hit, however, the index has tended to bounce back. The rest of the performance data on the table is measured from the close on the day the streaks ended so the numbers do not include the typically bad “day 1″. 2 weeks later, 12 of the 14 had positive returns and had nearly recouped the median day 1 loss. By 3 weeks, all but 1 (1961) showed positive returns and the median return had more than doubled up the day 1 loss.
After that, the returns were more or less in line with any average days. 3 of the streaks nearly marked longer-term tops as the S&P 500 was lower a year later (1961, 1965 & December 1972). The other 11 saw the index higher over the following 12 months, with negligible drawdowns over the subsequent 6 months.
How long will the current streak last? It’s impossible to say. Only 3 have ever lasted longer, with just 1 of them going past 48 days. What will happen to stocks once the streak ends? Obviously, that is impossible to know as well. However, the general pattern has been for the streak to end somewhat violently on the first day, then recover in the weeks following.
Time will tell how long this bull can levitate – and how far its riders will get tossed once it succumbs to gravity.
_____________
More from Dana Lyons, JLFMI and My401kPro.
The commentary included in this blog is provided for informational purposes only. It does not constitute a recommendation to invest in any specific investment product or service. Proper due diligence should be performed before investing in any investment vehicle. There is a risk of loss involved in all investments.


