1 > 40

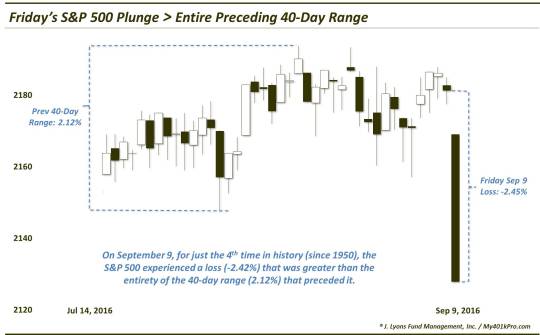
Friday’s stock market plunge was greater than the entire range of the previous 40 days.
With today’s impressive rebound in stocks, Friday’s selloff seems like ancient history already. However, as we haven’t gotten a chance to comment on Friday’s action, our Chart Of The Day takes a look back on the historic day. There are countless angles to Friday’s action that we could look at, so picking one is tough. However, seeing as though the tight range of the past few months was just as historic as Friday’s abrupt ending, it seems appropriate to focus on that aspect. And perhaps the most remarkable statistic that we uncovered pertaining to that development was the following:
Friday’s loss in the S&P 500 of -2.45% was larger than the entire range (2.12%) of the preceding 40 days.
In several recent posts focusing on the market’s historically tight 2-month range, as well as its refusal to budge even a percent from its 52-week high over that time, we mentioned that similar markets in the past have seen abrupt endings to such streaks. That is, while it is extremely tough to time the ending to such slow creeping uptrends, when it does end, we often see the several weeks’ or months’ worth of gains wiped out in just a few days. That’s not surprising given that markets get coiled up so tight in these instances that a break of a range can release a lot of market “energy”. Friday’s rout provided a textbook example of that.
But what happens after these violent endings to calm markets? Well, the number of historical precedents of a 1-day loss wiping out the entire range of the previous 40 days (approximately 2 months) is painfully small. Since 1950, there have been just 3 other such occurrences: 2/9/1953, 10/19/1987 and 10/13/1989.
The 1953 event saw the S&P 500 struggle to make any headway over the subsequent year. 1987 saw the market bottom immediately following the crash and 1989 saw the market bounce in the short-term then drift. If we consider the 40-day range of just high and low closes, then we can add just 1 more instance: 2/27/2007. Stocks saw a bit more selling over the subsequent weeks, then bounced strongly in the intermediate-term.
3 or 4 precedents is not a lot to go on so let’s widen the net a bit. If we look at 1-day losses that wiped out just its preceding 1-month (or 21-day) range, we get just 7 more, including the post-Brexit decline. 11 total samples is still small, but enough to work with in looking for possible tendencies.
So what happened after these prior selloffs? The day after (not shown in the table below) was mixed, with the S&P 500 closing higher 5 times and lower 6 times. However, the winners were considerably larger than the losers with 4 of them gaining more than 2%, so today’s rebound was not out of the ordinary. After that, things are pretty interesting as this table of precedents shows.
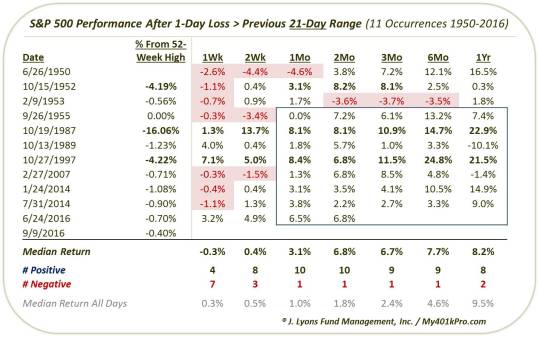
1 week after the violent, range-smashing losses, just 4 of the 11 prior occurrences saw gains. This was the low-point, however. By 1 month out, 10 of the 11 showed gains in the S&P 500 by a median of +3.1%, triple the median of all days. Furthermore, as highlighted in the table, all 8 occurrences
since 1955 saw gains in the S&P 500 over every time frame from 1 month to 1 year out. So the more recent examples have led to especially positive action.
One more distinguishing angle that is appropriate to highlight here is the proximity of the S&P 500 to its 52-week high as of the day before the selloff. Like Friday’s occurrence, 7 of the prior precedents saw the index within 1.23% of its 52-week high when the selloff began. The other 3 (10/15/1952, 10/19/1987 and 10/27/1997) began while the S&P 500 was at least 4% away from its 52-week high. Those 3 saw the best gains in the intermediate-term as they were the only ones up by at least 8% by 2 months later. So perhaps they simply had more upside based on mean-reversion potential alone. That would not be the case in our present circumstances.
Lastly, it is interesting that fully half of these occurrences took place in September or October, the most dubious time of the year for the stock market. This poor seasonality continues to be of some concern to us presently. In addition, widespread, frothy investor sentiment likely will need to be unwound much further before a durable bounce.
So, in our view, stock bears do have an assortment of legitimate concerns out there over the intermediate-term. However, based solely upon similar historical precedents, violent selloffs like Friday’s that wiped out an entire month (or two) of gains should not be one of them.
_____________
More from Dana Lyons, JLFMI and My401kPro.
The commentary included in this blog is provided for informational purposes only. It does not constitute a recommendation to invest in any specific investment product or service. Proper due diligence should be performed before investing in any investment vehicle. There is a risk of loss involved in all investments.


