An ‘Appealing’ Market

This piece originally appeared as the August 2016 edition of the J. Lyons Fund Management, Inc. Newsletter at www.jlfmi.com.
Re-examining the evidence, in favor of and opposed to, a further extension of the bull market
“Positive developments in recent months may have bought the bull market a little more time – and perhaps another all-time high – before its eventual slaughter.”
– JLFMI June 2016 Newsletter
Anyone who has had the misfortune of enduring a trip through the labyrinth that is the modern-day judicial system knows that it can be a painfully drawn-out process. In our June Newsletter, we used the judicial system in a metaphor to describe the present state of the U.S. equity market. Specifically, our contention for the past 16 months has been that the post-2009 bull market’s days were numbered. That said, like the legal process, market tops can also be long, drawn-out affairs. As such, we pointed to several developments associated with the post-February stock rally that appeared to provide the bull with a “stay of execution” for the time being. Indeed, the postponement of the execution order has allowed at least the major stock averages to achieve new all-time highs in recent weeks.
A “stay”, however, is a temporary hold. Eventually, the case will come up for appeal and the appropriate evidence will need to be presented again. At that point, it will be decided anew whether to extend the stay – or execute the original order. Similarly, with several market averages having gone on to new highs, it is appropriate to revisit the stay of execution order on the bull market. One of our oft-repeated observations arguing for a new high in the market has been the very tentative investor sentiment throughout the post-February rally. Markets top amidst ebullience, not skepticism. And the one development that we surmised may finally tilt sentiment to the bullish extreme was a new high in the stock market. And indeed, with the recent breakout to new highs, we have seen a notable, bullish, shift in sentiment.
But has this sentiment shift been extreme enough to warrant an end to the recent rally? Furthermore, is it enough to offset the considerable array of bullish evidence that was the focus of our June Newsletter? The bull market’s stay of execution is up for appeal. Does the bull have more room to run – or is its time up? Let’s examine the evidence, bullish and bearish, to reach a verdict.
Disclaimer: While this study is a useful exercise, JLFMI’s actual investment decisions are based on our proprietary models. Therefore, the conclusions based on the study in this newsletter may or may not be consistent with JLFMI’s actual investment posture at any given time. Additionally, the commentary here should not be taken as a recommendation to invest in any specific securities or according to any specific methodologies.
In The Bull’s Defense
Price Action
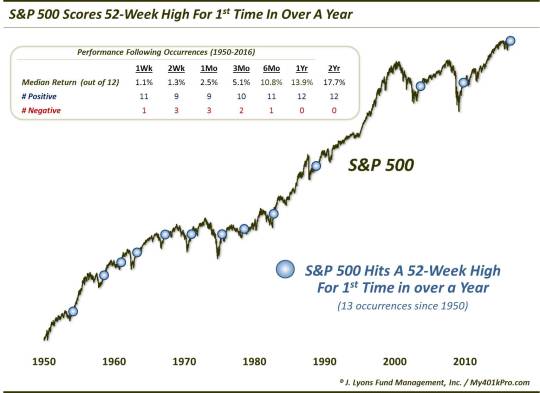
First and foremost, the price action continues to be constructive following the February lows, in particular for the large-cap averages. Not only have the averages surpassed all of the standard resistance and retracement levels associated with the action over the past 15 months, they have now broken out to all-time highs. And despite what anyone tells you, that’s NOT bearish. In fact, advancing to all-time highs is the most bullish thing that stocks can do. Sure, that is where tops are formed – but only at the very end. Most new highs lead to further new highs.
That tends to particularly be the case following lengthy spells without a new high, as evidenced by a recent study we did. As the following chart reveals, when the S&P 500 notches a new 52-week high for the first time in more than a year, it has added to the gains over the subsequent year and 2 years without fail – and almost always in the shorter time frames as well.
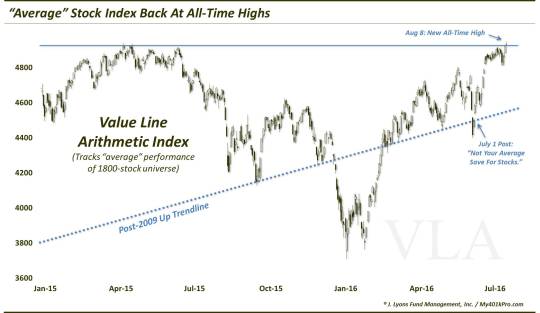
Importantly, in recent days, we have seen an expansion in the areas reaching new highs. Along with the aforementioned large-caps, some of the broader indices, like the Wilshire 5000 and Value Line Arithmetic Index (tracks the performance of the “average stock”) have recently attained all-time high ground again. This expansion is a key development for the bull market’s intermediate-term prospects as it provides a broader foundation upon which to build.
Breadth
Among the hallmarks of the post-February rally has been the impressive breadth. One manifestation of that, which we showed in the June Newsletter as well, has been the performance of the NYSE Advance-Decline Line. Specifically, its action has been most notable in its attainment of a new all-time high back in April. As we have mentioned, this was an important development considering the fact that every cyclical stock market top in the last 50 years has been marked by a divergence in the A-D Line. That is, every top in the S&P 500 has been accompanied by an A-D Line that was below its prior high.
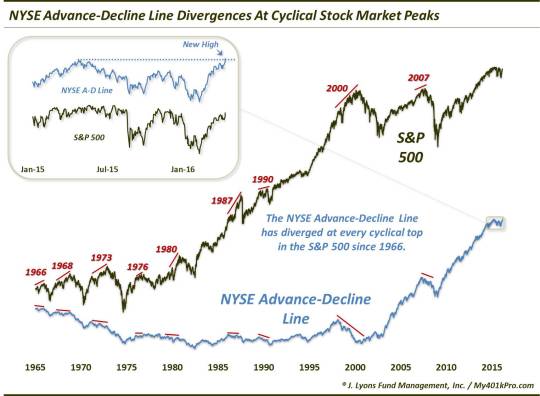
You may recall that there was an A-D Line divergence at the May 2015 high in the S&P 500 which raised a serious red flag in our eyes. And while that episode was followed by a few tumultuous episodes in the market (e.g., last August and early 2016), not only has the S&P 500 bounced back to a new all-time high but so has the A-D Line. Furthermore, the A-D Line continues to make new highs here in early August.
We will note that some of the proprietary breadth measures that we incorporate in our Risk Model are losing momentum and in danger of turning negative. That said, any potential ramifications of such a development would likely be limited in scope to the short to intermediate-term. In the longer-term, again, the breadth landscape has brightened considerably from a year ago.
Seasonality
I know, most folks are probably thinking isn’t August-October usually a rocky period for stocks? Yes, it is true that this upcoming stretch is historically the toughest for the stock market. However, our view is that seasonality should be merely viewed as either a mild headwind or tailwind for stocks. And with that said, there are a few trends pertaining to seasonality that we’ve uncovered which may tilt the current period into the “tailwind” category for stocks – perhaps.
Despite the historically rocky August-October period, there may be an exception to that rule this year. That’s because the 3rd quarter of an election year has the best historical average return (+5.0% for the Dow) of any quarter in the 4-year Presidential Cycle.
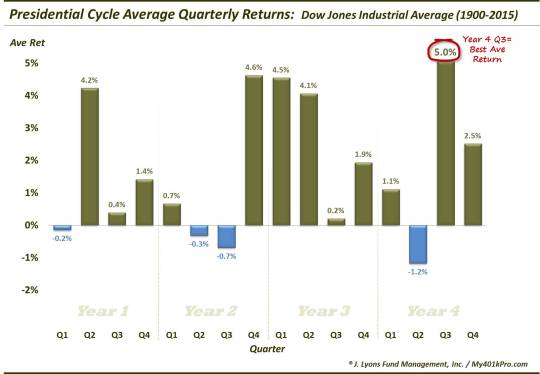
Indeed, the Dow is already up nearly 4% for the quarter thus far. Thus, a good chunk of the average gain has already been realized and the tailwind may not be quite as strong for the remainder of the quarter. Furthermore, for years in which there is no incumbent running for President, average returns for this quarter have not nearly been as strong. So despite the shift in 3rd quarter winds during an election year, perhaps this one is a push at this point.
A more important data point, in our view, deals with market tops vis-à-vis the months of the year. With the Dow moving to a 52-week high last month, it is worthwhile to note that since 1900, the Dow has never formed a 12-month top in the month of July. In other words, of the 35 July’s since 1900 that have seen the Dow trade at a 52-week high, the index has traded higher at some point over the next 12 months every time.
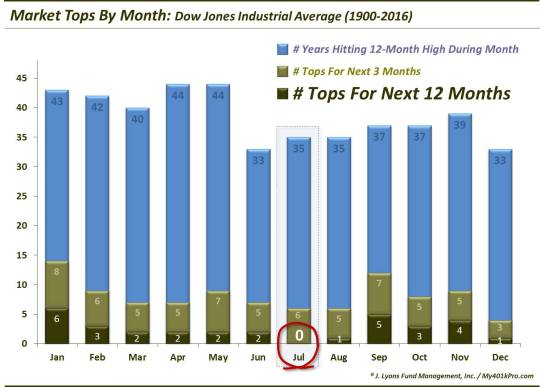
Now, yesterday saw the Dow hit a new all-time high, eclipsing its July 20 high. Thus, the higher post-July high has been satisfied. And the research does not guarantee that the Dow will necessarily make anything other than a marginal new post-July high before suffering a longer-term correction, ala 2007. Furthermore, even if the index does go on to more meaningful new highs over the next 12 months, this does not preclude a sharp, shorter-term selloff in the interim, ala 1998. So, while the historical trend arguing against a July top has held true once again, the data doesn’t say how much higher or longer the bull market will go.
In Opposition To The Bull
Non-Confirmations
While breadth has been excellent over the past 6 months, not every broad measure has gone on to new highs like the NYSE A-D Line has. Indeed, indices like the NYSE Composite, the Russell 2000 Small-Cap Index and our favored Value Line Geometric Composite, which tracks the “median stock performance”, are still well below their all-time highs.
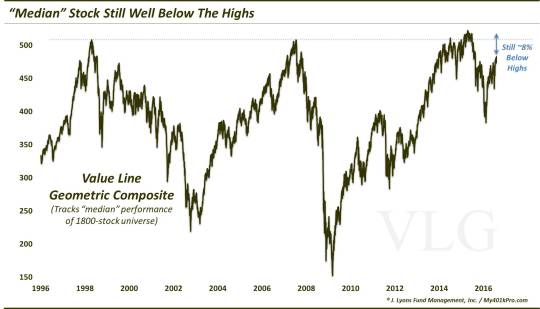
While these indices may yet move to new highs, this non-confirmation on the part of these key broader indices is a concern. You may be familiar with the Dow Theory which raises a warning sign if either the Dow Jones Industrial Average or the Dow Jones Transportation Average hit new highs while the other index does not. Similarly, the inability of these broader indices to yet hit new highs means that all is not necessarily “blue skies” for stocks here. There are still challenges ahead before the broader market also hits new highs.
Sentiment
Along with stellar participation (breadth), another hallmark of the post-February rally has been constructive investor sentiment. And by constructive, we mean skeptical. After the sharp selloff at the beginning of the year, investor sentiment dropped to rock-bottom levels. That was one circumstance that allowed a new intermediate-term rally to commence. The market had run out of sellers for the time being. And as the rally unfolded, sentiment was slow to rise, even as stocks approached their former highs. This condition served to prolong the duration of the rally as it signified a pool of potential new capital capable of entering the market.
We mentioned on several occasions during late spring and into June that a new all-time high may be the necessary ingredient to finally draw in investors and shift sentiment to the bullish side. Indeed, after the major large-cap averages were able to finally score new highs, we have noticed a significant concomitant shift in sentiment. It is evident in real-money gauges, like the volatility market and some put/call ratios, as well as in various investment surveys. It is also becoming fairly pervasive across the marketplace, from money managers to retail investors.
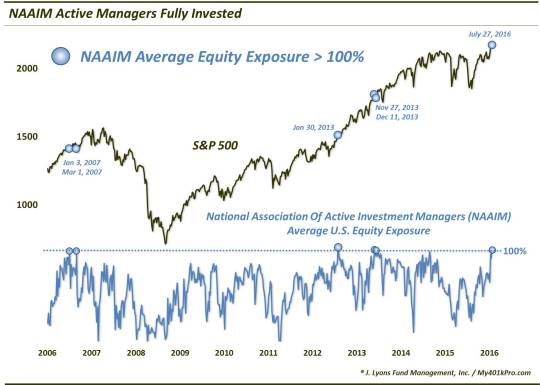
On the manager side, one piece of evidence pointing to a newfound extreme in bullishness comes from the NAAIM Exposure Index, a survey of active manager equity allocation. We call the NAAIM survey (of which we are a part) a semi-real money indicator as it is a survey of the allocations of active managers, though, they are not verified. That said, we can tell you that, personally knowing many of the managers involved, we are quite confident of their truthfulness and in the accuracy of the survey.
In recent weeks, the survey has reached over 100% allocation to equities for just the 6th time going back to 2007. And while we know that many of these folks are very good money managers, once any crowd measure hits historic extremes, one should be leery of the sustainability of any market gains going forward. On the plus side, the previous NAAIM readings over 100% did not lead to any imminent calamity in the stock market.
Additionally, investors are becoming extremely complacent about stock market risk. Recent weeks have seen a rush to unload equity hedges as the indices have moved to new highs. This is evidenced, in one example, by the extremely depressed level of activity in inverse ETF’s recently. Specifically, volume in these funds, which rise when the stock market falls, has dropped to the 2nd lowest level in 5 years as a percentage of total market volume.
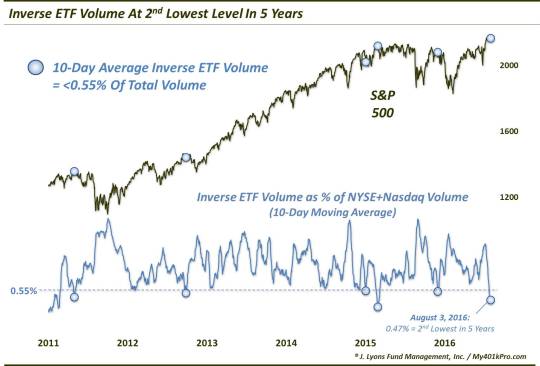
Contrary to the track record following the elevated NAAIM readings, prior low levels of inverse ETF volume in the past 5 years have stock market drawdowns of various magnitude. Now, as the market climate has been extremely positive overall during the past 5 years, the drawdowns were not necessarily long lasting. However, there was consistent weakness, at least in the months following such complacent readings.
Indeed, while overly exuberant sentiment is developing into our main concern at this time, any potential repercussions should be short to intermediate-term in scope. These types of sentiment indicators are very sensitive to the gyrations in stock prices. Thus, should we see any sharp, corrective action in prices over the next few weeks or months, this bullish sentiment can cool off just as quickly as it heated up.
Background Indicators
As most sentiment measures are most relevant on a short to intermediate-term basis, the conditions do not necessarily carry repercussions for the post-2009 cyclical bull market. On the other hand, the long-term “background” indicators that we have often made mention of certainly do. In fact, these long-term measures of valuation, investor allocation, and macro-trend position, etc. have as much relevance to the secular cycle (i.e., post-2000 bear market) as they do to any shorter-term cycle. And until these measures of excess that were formed into the secular bull market top of 2000 can be adequately worked off, and then some, a durable secular bull market is unlikely to begin (this includes the % of Household Assets Invested In Stocks as shown here; the chart is from a year ago but the series remains near the same level).
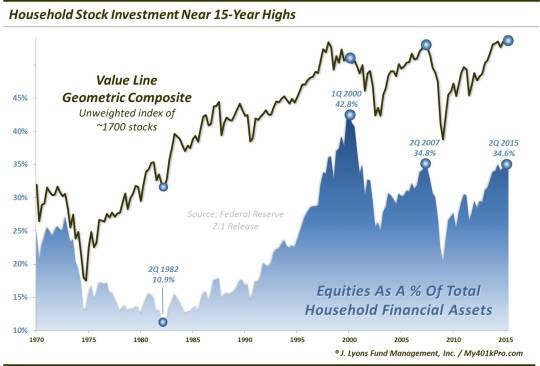
Read our May 2014 Newsletter for more “background” and specifics on these longer-term conditions.
Now, obviously these long-term factors do not preclude significant intermediate-term (i.e., post-February) or cyclical (i.e., post-2009) rallies from taking place. Nothing goes in a straight line. However, the question for long-term buy-and-holders is one of sustainability. And as impressive as these rallies have been during their duration, their gains are unlikely to be sustained. Therefore, ultimately, it will likely take a combination of substantial market declines and a prolonged period without gains to wring the secular cycle of these excesses and support a sustainable bull market.
The Verdict
So in examining all of the new evidence, what is our verdict in this appeal on the part of the bull market? Due to the preponderance of the evidence here as well as much more evidence unmentioned (most importantly, our Risk Model), our vote is in favor of extending the stay of execution for the bull market. In other words, we do not see compelling evidence suggesting an imminent end to the bull at this time.
That said, overly complacent sentiment is becoming our biggest concern in the near-term. This condition suggests a high probability that any further short-term gains may be wiped out in the next several months. At the moment, our indicators are still positioned positively and the price and breadth action is still constructive. However, that can change tomorrow and, armed with new evidence, we would review the case once again.
At this point, though, while the bull may wind up spending some time in a “correction” facility, he looks likely to live another day.
Dana Lyons
Partner
The commentary included in this newsletter is provided for informational purposes only. It does not constitute a recommendation to invest in any specific investment product or service. Proper due diligence should be performed before investing in any investment vehicle. There is a risk of loss involved in all investments.
Copyright © 2016 J. Lyons Fund Management, Inc. All rights reserved.
_____________
More from Dana Lyons, JLFMI and My401kPro.
The commentary included in this blog is provided for informational purposes only. It does not constitute a recommendation to invest in any specific investment product or service. Proper due diligence should be performed before investing in any investment vehicle. There is a risk of loss involved in all investments.


