Is The Selloff Over — Or Just Getting Started?

Multiple 90% Down Volume Days in quick succession have often marked the culmination of selloffs – but not always.
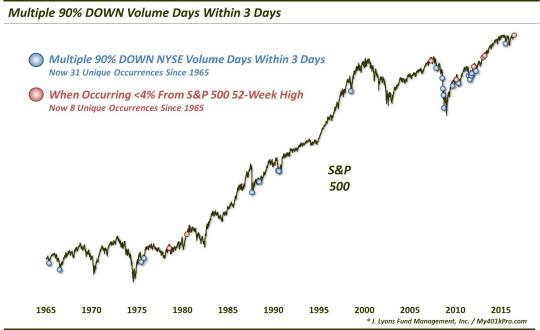
We’ve covered the topic of “90% Volume Days” on several occasions over the past few years (maybe too often – see below). To refresh, these refer to days on which 90% of the volume on an exchange (typically the NYSE) is concentrated either in advancing stocks (90% Up Days) or declining stocks (90% Down Days). The idea behind this concept is that such concentration can be emblematic of investor sentiment that has gotten too one-sided. This is especially the case with 90% Down Days as they have often signaled capitulation by investors and a potential nearby bottom. This is especially the case when we see multiple 90% Down Days within a short time period. That’s what we’ve witnessed over the past few days.
Specifically, last Friday and yesterday (Tuesday) saw 90% Down Days on the NYSE, making it 2 out of 3 days. Since the beginning of our volume records in 1965, this has only occurred on 30 unique occasions prior to this one.
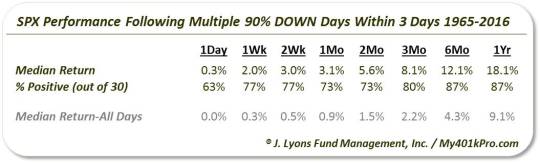
As you can see from the historical performance following these clusters of 90% Down Days, returns were greatly skewed to the upside.
This would certainly seem to bode well for stocks’ prospects from this point. However, there is a potential catch. As we have discussed in past posts, when occurring from close proximity to a 52-week high, 90% Down Days do not have nearly the positive impact as they do overall. The same goes for multiple 90% Down Days within 3 days when occurring near the highs.
Specifically, this current instance marks the 8th time these clusters of 90% Down Days have originated from within 4% of the S&P 500′s 52-week high. And while returns going forward were not disastrous, this was not the green light signal suggested by the results of the overall sample of events.
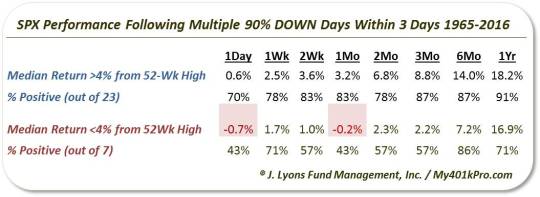
Obviously 7 is a very small sample size over the course of 50 years. However, as the table shows, much of the upside “juice” to the overall results comes courtesy of those events occurring further away from the 52-week high.
In fact 4 of the 7 events occurring within 4% of the 52-week high saw the S&P 500 down 1 day and 1 month later. And though the median returns over those periods were barely negative, 3 of the events did see accelerated selling following the events. Occurrences in October 1978, July 2007 and May 2010 saw the S&P 500 drop at least 5% over the subsequent 3 weeks. Therefore, this somewhat unusual occurrence so close to a 52-week high does give us pause in becoming too bullish based on this signal.
Another thing that gives us pause is what we alluded to at the beginning of the post. These 90% Days – and clusters of them – are occurring much more frequently than they used to. For example, over the 41 years from 1965-2006, these clusters of 2 90% Down Days within 3 days happened just 11 times, or once every 3.7 years. In the past 9 years, there have been no less than 20 of them, or more than one every 6 months. And that does not even include several overlapping occurrences in 2008 and 2011.
Why is this occurring more frequently? There are many possible explanations, but we think it is clearly, in part, due to the increased influence, and volume share, of HFT’s and algorithm-based computer trading. These entities have combined to make for an environment more prone to “all-or-nothing” type markets. Thus, the proliferation of 90% Days.
Because of that, as well as the market’s relative close proximity to its 52-week high, we have a hard time putting much faith in a bottoming signal here based on this development. This 90% Down Day cluster may not necessarily be the start of something more nefarious, but neither are we confident that it is the end of the selling.
_____________
More from Dana Lyons, JLFMI and My401kPro.
The commentary included in this blog is provided for informational purposes only. It does not constitute a recommendation to invest in any specific investment product or service. Proper due diligence should be performed before investing in any investment vehicle. There is a risk of loss involved in all investments.


