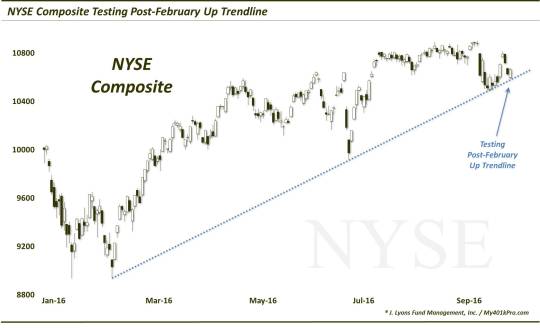
Post-February Uptrend In Stocks Being Tested

Key indices across the U.S. equity market are testing their uptrend lines stemming from the February lows.
It’s only fitting that today’s Chart Of The Day includes a trendline considering our regular “Trendline Wednesday” feature on Twitter and Stocktwits (follow us on both platforms: @JLyonsFundMgmt). Granted, it’s not the most profound trendline we’ve ever monitored. However, it very well may be quite significant on an intermediate-term duration. Furthermore, as the subheading indicates, there are many other segments of the market presently being impacted by trendline dynamics
similar to those illustrated in the example here.
So what are we looking at? The index is the broad NYSE Composite and the trendline is the uptrend defining the post-February rally. Specifically, the trendline originates at the February lows in the NYSE and connects the June Brexit lows as well as the early September lows. Why is this line so important? First of all, because it traces out the precise lower bound of the NYSE’s post-February rally. Secondly, the NYSE is presently testing the top of this line

So is this line going to hold? In a vacuum, the assumption is always that a trendline should hold – until it doesn’t. Therefore, in this instance, the recent price weakness should be contained at these levels. Thus, if one is looking to “buy the dip”, this seems a reasonable spot to do so.
That said, price does not operate in a vacuum. There are many factors at work in determining the direction of a market. And while the price of one index, in and of itself, is the final arbiter of direction, price is not really a forecasting tool. So, while price can tell us where a security is, it doesn’t reliably tell us where where the security is going. On the other hand, there are other market inputs that can provide us with clues about the future direction of prices.
For us, chief among these “other inputs” is our proprietary Risk Model. This Model, which we’ve been utilizing for nearly 4 decades, is primarily an amalgamation of market breadth, momentum and money flows and is designed to instruct us as to the direction of the overall, broad stock market. The Model is significant on an intermediate-term duration (i.e., 6 weeks to 6 months), aimed at exploiting those substantial moves that can occur within that time frame. Often times, especially at major tops, this Risk Model will turn Negative prior to the prices of the major averages turning south. The Risk Model has recently turned Negative.
There are other factors that have us questioning the likelihood of the NYSE holding its uptrend line, including sentiment, seasonality and the fact that prices have now tested the trendline twice within a few weeks. That frequency is a change in character and suggests caution in assuming the trendline holds.
Now, is it the end of the world if this line gets broken? Not really, but it may be the end of the post-February intermediate-term rally in stocks. Or, at a minimum, it may signal the end of the post-Brexit phase of the rally. Considering the way the NYSE has closely adhered to the trendline, prices certainly seem to “respect” the line. Thus, in the short-term, upon a hypothetical break of the trendline, a quick acceleration to the downside would seem to be a reasonable risk.
Again, a break of this trendline doesn’t necessarily mean the larger trend has turned down. It may just mean a shallower trajectory once the rally resumes. But it certainly opens the market up to not insignificant short-term risk. And on an intermediate-term basis, it would be one of the first chinks in the armor of the impressive post-February rally.
________
More from Dana Lyons, JLFMI and My401kPro.
The commentary included in this blog is provided for informational purposes only. It does not constitute a recommendation to invest in any specific investment product or service. Proper due diligence should be performed before investing in any investment vehicle. There is a risk of loss involved in all investments.


