Smaller Stocks Bounce Off Important Line

Popular indices in both the small-cap and mid-cap spaces have held key longer-term support levels…thus far.
After riding the tea cups for 2 months, the stock market continued its newfound gut-wrenching roller coaster today, this time on the upswing. Why did it bounce today? Besides the canned media/punditry’s narratives – e.g., weak economic data puts the Fed on hold next week, etc. – there were plenty of technical reasons for a bounce to materialize where it did. The popular big-cap averages, e.g., S&P 500, Dow, etc., approached tests of their July breakout levels. Former leaders in the defensive and high yield equity areas are testing their breakout levels from last spring. And new participants to the rally, like financials and Europe, are testing recent breakouts of their year-long downtrends. Then you have the small-caps and mid-caps. These areas, importantly, were able to hold key support lines stemming from the inception of this cyclical bull market. Let’s take a look.
First off, we have the Russell 2000 Index (RUT), the most widely followed index of small-cap stocks. Over the past few days, the RUT managed to hold, and bounce off of, its post-2009 Up trendline.
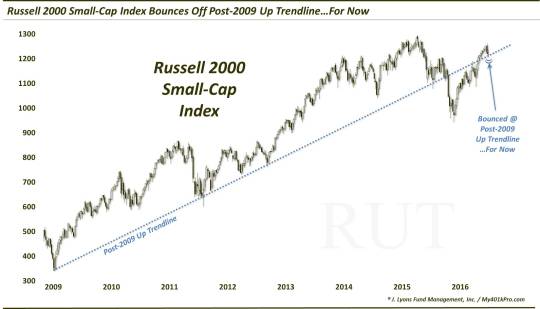
As the weekly chart above shows, the Up trendline starts at the bull market low in March 2009 and connects lows throughout 2011, 2012 and 2015 (though, one day, October 3, 2011, sliced through the line temporarily). In January of this year, the RUT finally broke below the trendline, leading to a brief waterfall-type decline.
Once trendlines get broken, most observers tend to throw them by the wayside. However, we have found that trendlines can maintain their validity even after being broken. In the aftermath of broken uptrends, for example, trendlines can serve just as effectively as resistance as they did in providing support. And even in the event that prices reclaim the topside of the formerly broken up trendline, the line will often serve as trend support once again.
That is what occurred in the Russell 2000 in early July. After prices broke back above the post-2009 Up trendline, they accelerated to the upside, validating the line again as relevant. Presently the trendline is around the 1200 level on the RUT. That is not far off from where the index bottomed yesterday near 1206.
If the RUT can hold above the trendline, its pace of advance can continue. If it fails to hold the line, it doesn’t automatically mean the uptrend is over. However, the trajectory of any rally will necessarily be shallower. And furthermore, a break would likely open up an additional 50-60 points (4-5%) of downside, potentially in fairly short order.
Looking at the S&P 400 Mid-Cap average, we see precisely the same story. The strong breadth associated with the post-February rally enabled the S&P 400 to achieve new all-time highs back in July. In the process, it too recovered its post-2009 Up trendline. And over the past few days, it too bounced from the vicinity of the trendline, near 1500.
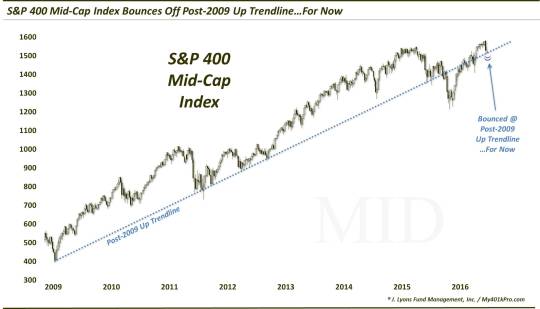
The message here with the S&P 400 Mid-Cap Index is the same. If it can hold above the trendline, its pace of advance can continue. If it fails to hold the line, the trajectory of any rally will automatically be shallower. Additionally, a break would likely open up an additional 50-80 points (3-5%) of downside in the immediate-term.
When markets get particularly noisy like they are this week, it can be difficult to maintain focus on the proper criteria for making investment decision. But if you can identify one straightforward but effective input to guide your investment or trading decisions, it can be a big help in keeping you on the right side of a trend – and in overcoming paralysis by analysis.
In our view, these post-2009 Up trendlines on the Russell 2000 and S&P 400 are as good a barometer as any in helping one stay on th right side of the trend in the small-cap and mid-cap spaces.
_____________
More from Dana Lyons, JLFMI and My401kPro.
The commentary included in this blog is provided for informational purposes only. It does not constitute a recommendation to invest in any specific investment product or service. Proper due diligence should be performed before investing in any investment vehicle. There is a risk of loss involved in all investments.


