Stocks Suffer Unprecedented Volatility Shock

Following a record tight 2-month trading range, the stock market exploded with 3 consecutive 1%+ moves; what’s next?
Following our myriad of “narrowest range ever!” posts from late July through early September, it is nice to observe a pickup in volatility in the stock market. At least, for those who view volatility as opportunity. That said, the fact that stock volatility shifted directly from 1st to 5th gear (e.g., 3 straight daily moves of more than 1%) has made for an uncomfortable ride for investors this past week. In fact, in some ways, this shift has been unprecedented in market history. Consider the following:
- Prior to last Friday, the S&P 500 had not seen a single 1% daily move in more than 2 months. From Friday through Tuesday, it experienced 3 in a row. You have to go back to February of 1953 to find the only other time in history the index did such a thing.
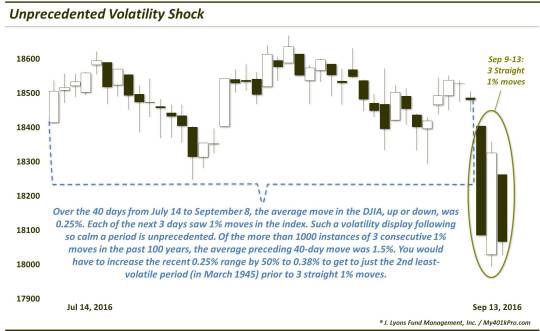
- Using the Dow Jones Industrial Average (DJIA), as of last Thursday, September 8, the average move, up or down, over the previous 40 days was 0.25%. In the last 100 years, just 62 out of more than 25,000 days (or 0.24%) registered 40-day readings that low…all occurring in 1964-65. As you might guess, the DJIA’s 3 straight 1% moves on the heels of that tight range is unprecedented. In fact, since 1900, of the more than 1000 instances of 3 consecutive 1% moves, the
preceding
average 40-day move was 1.5%. You would have to bump up that 0.25% by 50% to 0.38% to get to just the 2nd least-volatile period (in March 1945) leading up to 3 straight 1% moves.
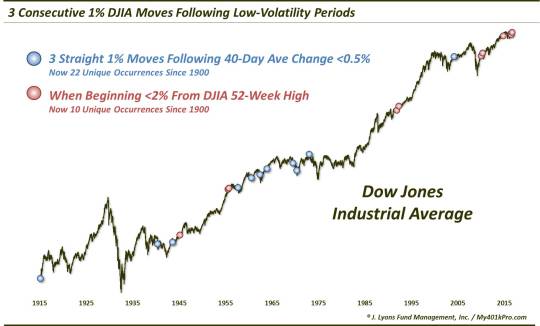
Focusing on that latter data point and the chart above, let’s relax the parameters a bit to observe other historical instances of 3 consecutive 1% moves coming on the heels of a very non-volatile stretch. Specifically, if we look at 3 straight 1% moves in the DJIA following 40-day periods when the average move was less than 0.5%, we come up with 22 occurrences in the past 100 years, including the present case.
Of the prior 21 events, one of them – in early January 1973 – saw each of the 3 1% days going to the upside. So that doesn’t exactly fit our present circumstances. Interestingly, however, 6 days following the occurrence, the DJIA put in a top that would last until November 1982. The other 20 mostly saw a combination of up and down 1% days, though, a few did show all 3 1% days to the downside.
What kind of behavior did we see from the stock market following these events? Overall, the choppy action continued in the near-term, as the following table reveals.
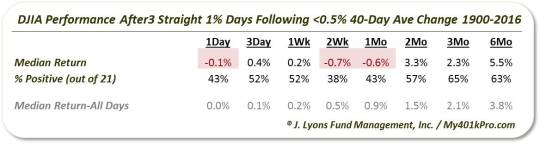
Median returns alternated up and down over the following days, weeks and months as heightened volatility continued to some degree. By 3 months after, 2/3 of the instances saw positive, and slightly above-average, returns. That would be the case out to 1 year.
But do those sloppy results help us at all? Perhaps delineating the sample further may be more helpful. One way we like to do that, as readers are well aware of by now, is to break down the events by their proximity to the market’s 52-week high. In our current case, the volatility shock began 3 days ago with the DJIA less than 1% from its 52-week high. Looking at the prior precedents, we split them up between those beginning within 2% of the DJIA’s 52-week high (9 occurrences) and those beginning from further than 2% (12 occurrences).
The following table shows the historical performance based on this delineation.
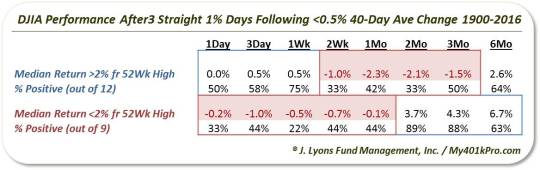
As you can see, those instances occurring further away from a 52-week high tended to bounce in the very short-term, i.e., up to a week. That suggests that the volatility shock may have been a sort of temporary washout under those conditions, perhaps. After a week, however, those occurrences succumbed to more weakness as median returns were negative out to 3 months.
On the other hand, events occurring within 2% of the DJIA’s 52-week high were more consistently weak in the days and weeks following the shock. Median returns were negative out to a month after. This suggests that the volatility shock was the beginning of a larger bout of weakness in the market. That said, the weakness did not tend to last beyond a month as after 2 months, 8 of the 9 instances saw the DJIA higher. Thus, in most cases, the trends that had the market near 52-week highs to begin with eventually reasserted themselves.
Will any of this provide a roadmap for our present circumstances? We don’t know. However, subjectively, the latter look certainly fits with what we’ve seen in prior studies. Specifically, that is so regarding the tendency for markets undegoing volatility shocks to persist in an elevated state of volatility in the short-term while the waters settle down again. Additionally, some renewed weakness would fit with what we’d like to see in some more dampening of investor sentiment that got way too hot over the past few weeks.
Time will tell what this volatility shock leads to, but we would suspect some more ripples at least in the weeks ahead.
_____________
More from Dana Lyons, JLFMI and My401kPro.
The commentary included in this blog is provided for informational purposes only. It does not constitute a recommendation to invest in any specific investment product or service. Proper due diligence should be performed before investing in any investment vehicle. There is a risk of loss involved in all investments.


