This Sentiment Reading Is Not Like The Others

Options data from the International Securities Exchange does not corroborate the frothy readings seen in most other sentiment measures.
We’ve mentioned several times in several different outlets that perhaps our biggest concern regarding the equity market
presently
is overheated sentiment. From professional active money managers to volatility traders to traders in bearish ETF’s and mutual funds, sentiment readings are registering either severe complacency or downright bullishness. This nearly unanimous optimism is what has us concerned.
And then there’s the equity options trading on the International Securities Exchange (ISEE).
Just when you start to think this stock “game” is easy, you wake up and realize that the market’s ducks are never all in a row. There is always something, or a few things, that don’t fit with the rest of the data – or one’s analytical narrative. Such is the case with the ISEE. That is because, using a 21-day moving average, the ISEE Call/Put ratio is at its lowest level since its inception in 2006 – as in, ever. In other words, in 10 years there has never been a 21-day stretch that saw fewer calls purchased relative to puts.
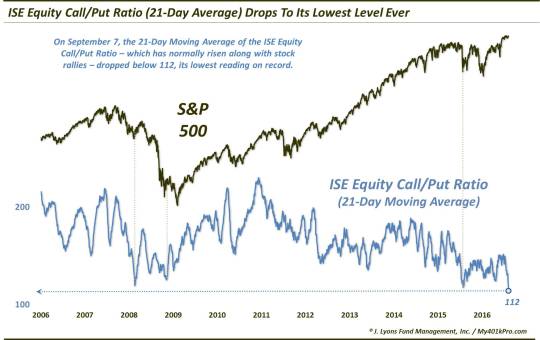
This one is a bit of a head-scratcher to us for a few reasons. First of all, the obvious. Like most options indicators, the ISEE has historically seen an increase in call buying relative to puts when the market was rallying. And while it is true that the market (i.e., the S&P 500) is flat over the past 21 days, it is still just a hair away from its all-time high. In fact, it has not dipped beyond 1% below its 52-week high in 2 months. To see such a dearth of call buying in these circumstances is highly unusual.
Secondly, as mentioned, the ISEE has always been one of our favorite options – and sentiment – indicators. One reason is the way in which the indicator is constructed. The ISEE only includes opening long positions in calls and puts, and only among smaller retail-type traders. These factors tend to weed out much of the noise associated with more advanced investors and more complicated strategies. Thus, the result is theoretically a more pure gauge of investor sentiment. And indeed, we have found the ISEE to be quite accurate and effective in producing contrarian sentiment signals.
And that’s what makes the current signal so peculiar. Low readings have historically been associated with severe weakness in the equity market. For example, the 3 lowest readings prior to the present one occurred in March 2008, December 2008 and August 2015. Our present record-breaking trading range bears no resemblance whatsoever to those prior periods.
Therefore, while under “normal” circumstances, we would consider this data point to be extremely bullish, presently, we’re not so sure. The signal is so unorthodox that we have to consider the possibility that some sort of structural change in the data is afoot. Therefore, it’s probably best to observe this data series for a while to see if it continues to be a reliable indicator of investor sentiment.
At a minimum, when “one of these things is (so) not like the others”, it diminishes our confidence in its message.
_____________
More from Dana Lyons, JLFMI and My401kPro.
The commentary included in this blog is provided for informational purposes only. It does not constitute a recommendation to invest in any specific investment product or service. Proper due diligence should be performed before investing in any investment vehicle. There is a risk of loss involved in all investments.


