Inside A Rare Signal In The S&P 500

The S&P 500 just put in 3 straight “Inside Days” for the first time in its history.
We have covered the concept of an “Inside Day” on a few occasions in the past. To refresh, it constitutes a day in which a security or index undergoes a higher low and a lower high than the previous day (the concept can be used over any time frame). The idea behind the supposed usefulness of such events is that it signifies a contraction in prices and indecision among investors. Trading textbooks would say that whichever way prices eventually break out of such a contraction (i.e., up or down), it is likely to determine the direction of the subsequent trend. Obviously nothing works “by the book” every time – especially in recent markets – but that is the notion behind the trading of “Inside Days”.
How rare are Inside Days? Well, on the S&P 500, they aren’t too uncommon, just enough to be “a thing”. In the history of the index going back to 1950, by our calculation, they occur about twice a month. Now, “Double Inside Days”, on the other hand, are much more uncommon. Those such events, whereby 2 consecutive days exhibit lower highs and higher lows than the prior day, have occurred, on average, about once a year for the past 55 years. Theoretically, Double Inside Days represent an even tighter contraction and, thus, the direction of the break should be even more meaningful.
And how about Triple Inside Days? Believe it or not, according to our data, the last 3 days represent the first occurrence of Triple Inside Days in the history of the S&P 500 (we cannot guarantee the accuracy of all historical data, especially very old data; therefore, it is possible that others may indeed find a previous occurrence or occurrences).
Obviously with no historical precedents, we cannot study the behavior of the S&P 500 following Triple Inside Days. Therefore, let’s go back to the Double Inside Days and have a look. As always, we want to study occurrences most similar to our present circumstances. As such, this chart shows all 29 Double Inside Days since 1950 occurring within 4% of the S&P 500′s 52-week high.
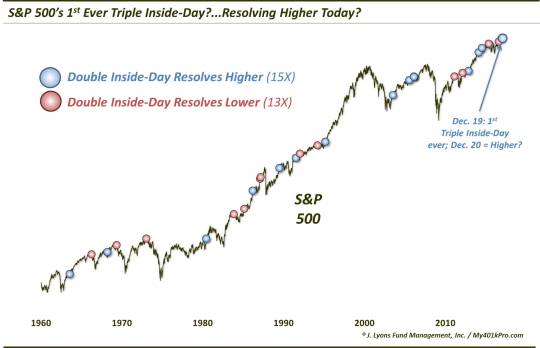
As the chart shows, the occurrences are broken down by which direction the S&P 500 initially broke out of its Double Inside Days. To determine that, we first went by closing prices. If the next day closed above the Double Inside Day’s high, we considered it a resolution higher. If it closed below the Double Inside Day’s low, we considered it a lower resolution. If the close was not outside the range of the Double Inside Day, we went by its intraday data. If it made a higher high, it went into the higher resolution camp and if it made a lower low, it went into the lower resolution camp. As it turns out, all 28 prior occurrences fell into one of these categories.
15 of the occurrences resolved higher and 13 resolved lower. What’s the point of this segregation? Remember that the allure of Inside Days is the supposed future directional “tell” based upon the direction of the break. Thus, this allows us to test the veracity of that notion, at least as it pertains to this specific data point. So did the higher vs. lower resolution events behave differently? You can judge for yourself.
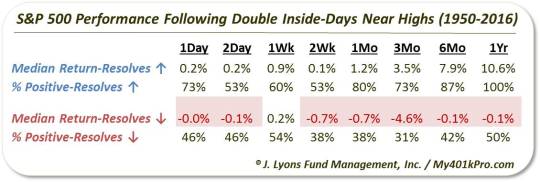
Overall, the results appear in line with the concept of the Inside Day. The 15 resolutions to the upside led to positive median returns across the board, from 1 day to 1 year. The positive returns were especially consistent following some choppiness over the first few weeks.
On the flip side, those events that resolved lower did generally deliver subpar performance going forward. Again, after some choppiness in the first week, median returns were negative, even out to 1 year. The consistency of the negative returns in the intermediate-term is especially noteworthy, particularly given the upward tendency of stocks overall.
Let’s bring it home to our present circumstances. With today’s higher high, this unprecedented Triple Inside Day goes into the higher resolution category. Does that guarantee further gains? Absolutely not – there are no guarantees. However, the results of the study here do nothing to discredit the theory that the direction of the initial break out of an Inside Day is indicative of the longer-term direction of prices.
Thus, if we have to give an edge, it goes to the bulls…again.
_____________
More from Dana Lyons, JLFMI and My401kPro.
The commentary included in this blog is provided for informational purposes only. It does not constitute a recommendation to invest in any specific investment product or service. Proper due diligence should be performed before investing in any investment vehicle. There is a risk of loss involved in all investments.


