Inside Another Record-Setting Streak For The S&P 500

The S&P 500 has now tied a record with 9 consecutive days trading within the range set 10 days ago; what are the ramifications of the streak and its resolution?
Last Monday, we noted that for the first time in the history of the S&P 500, the index put together 3 consecutive Inside Days. That is, for 3 straight days, the high-low range was inside the range of the preceding day. We have no record of that ever occurring since the inception of the index in 1950. As noted in that post, “the idea behind the supposed usefulness of such events is that it signifies a contraction in prices and indecision among investors. Trading textbooks would say that whichever way prices eventually break out of such a contraction (i.e., up or down), it is likely to determine the direction of the subsequent trend.” While no signal works 100% of the time, a study into price behavior following historical Double Inside Days in the S&P 500 did provide evidence for the theory that the direction of the initial breakout is a good indicator of the direction of the subsequent trend.
Well, since the S&P 500 initially broke the Triple Inside Days by putting in a higher high on December 20, the suggestion was that more upside was to follow. That hasn’t panned out – yet. The index closed today roughly 1% below its “breakout” close. So, it has work to do if it is going to perform according to the textbooks.
While that unprecedented inside streak came to an end, there is another inside streak that also reached an all-time record today. As mentioned, December 20′s high was higher than December 19′s high, breaking the consecutive Inside Day streak. However, if we look at the range of the day, December 14, that marked the beginning of the Triple Inside Days, we notice something quite remarkable. The high on December 14 was 2276.20 and the low was 2248.44. During the 9 trading days since, the S&P 500 has been unable to either eclipse that high or drop below that low. This is just the 2nd time in the history of the index that it has traded for 9 straight days without moving beyond the range set 10 days ago.
If we want to study price behavior following similar historical occurrences, obviously we need to relax the parameters given the fact that there is just a singular precedent: June 28, 2006. Therefore, we looked for instances of 5 consecutive days trading within the range of 6 days prior. This yielded 14 previous events since 1960.
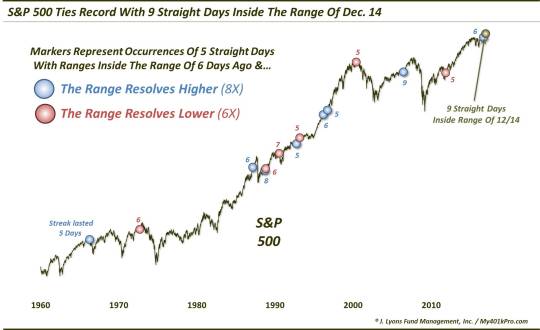
In reviewing the data, we could not discern any clues as to the direction of the eventual range break based upon the lead up to the inside streak. Thus, as the chart shows, we broke down the 14 events based on which direction they broke out of the range. Here are the dates on which the streaks reached 5 days, the number of days the streaks would reach, and the direction of the range break:
04/20/1966 5 Up
09/19/1972 6 Down
03/02/1987 6 Up
09/23/1988 8 Up
11/03/1988 6 Down
07/30/1990 7 Down
10/12/1992 5 Up
03/19/1993 5 Down
03/15/1996 6 Up
10/01/1996 5 Up
06/09/2000 5 Down
06/22/2006 9 Up
11/16/2011 5 Down
09/19/2016 6 Up
12/21/2016 9 ?
FYI, the range on December 14 was about 1.2% wide. Interestingly, despite the fact that our present streak is tied for the longest, only the October 1996 event saw a smaller range (1.1%) in the engulfing day.
By parsing the occurrences based upon the direction of the range break, we can see again if there is any evidence to back up the notion that it will consistently lead to a further move in that direction. And once again, we found evidence to back up that notion.
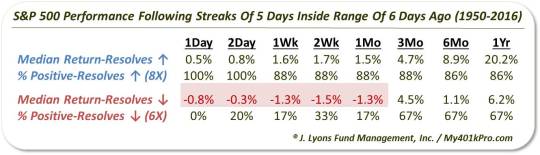
Of course the 1 Day returns include the initial range-breaking day and, thus, by definition, are all positive for the 8 upside resolution events and all negative for the 6 downside resolution events. That Day 1 also has some impact on subsequent returns. Nevertheless, we see that the returns are quite consistent in displaying follow through in the direction of the breakout. All but one of the upside resolution events were positive, from 1 day to 1 year. On the flip side, a majority of the downside resolution events showed negative returns from 1 day to 1 month.
We are not going to put too much weight into this phenomenon, vis-a-vis its eventual resolution. And to the extent that we do place any weight, it would just be in the near-term, e.g., up to 1 month. Any long-term conclusions, despite the fact that we have included them here, is probably a reach. 14 events is also a small sample size.
Those disclaimers aside, like the study into Double Inside Days, there is nothing in the results of this post that would suggest going against the textbook, directionally, once the range is finally broken.
________
More from Dana Lyons, JLFMI and My401kPro.
The commentary included in this blog is provided for informational purposes only. It does not constitute a recommendation to invest in any specific investment product or service. Proper due diligence should be performed before investing in any investment vehicle. There is a risk of loss involved in all investments.


