Broad Market Gauge Still Hasn’t Broken Out…Yet

One of the few indices yet to break out, the NYSE Composite is threatening its all-time highs.
One of the characteristics of the “Trump Rally” has been its breadth of participation. Sure, there have been a few sectors that have lagged badly. However, from a market cap standpoint, most indices, from micro-caps to mega-caps, have scored new all-time highs. It isn’t unanimous, though. A few broad market gauges have not quite made it to new high ground. The Value Line Geometric Composite is one that we mentioned last month. The NYSE Composite is another.

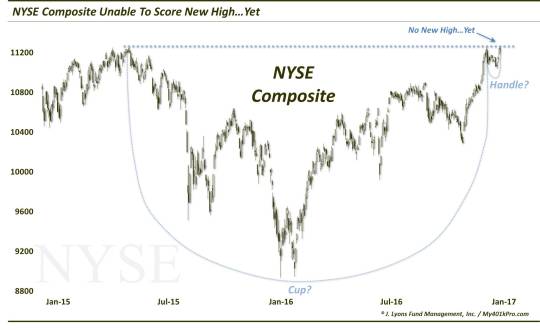
As the chart shows, the NYSE topped in May 2015 at the 11,240 level. After a tumultuous 19 months, the index finally returned to that level in December. And after a couple weeks of a pullback, it is back testing that level again, closing yesterday at 11,246.
A couple observations: First, we do not ever want to anticipate a breakout. That is, don’t buy something with the assumption that it will break out in case the resistance is too much to overcome. Think about the whole “Dow 20,000″ focus that seemed like an inevitability. Sure, it may still happen but the Dow has spent 4 weeks within inches of the level without yet attaining it. Rest assured that if a security or index does finally break out, there will be plenty of time and profits to reap should it indeed prove to be a successful breakout.
On the other hand, there is reason to be optimistic that the NYSE will indeed breakout. That optimism may partially be fueled by a potential cup-&-handle formation on the NYSE chart. As we’ve discussed on several occasions, this is considered to be a bullish pattern. What does it look like and why is it bullish? The pattern involves 2 parts, generally showing the following characteristics:
The Cup (May 2015-December 2016): This phase includes an initial high on the left side of a chart followed by a relatively long, often-rounded retrenchment before a return to the initial high.
The Handle (December 2016-January 2017): This phase involves a shorter, shallower dip in the security and subsequent recovery to the prior highs.
The bullish theory is predicated on the idea that after taking a long time for a stock to return to its initial high during the “cup” phase, the “handle” phase is much briefer and shallower. This theoretically indicates an increased eagerness on the part of investors to buy since they did not allow it to pull back nearly as long or as deep as occurred in the cup phase. Regardless of the theory, the chart pattern has often been effective in forecasting an eventual breakout and advance above the former highs.
Now, many technicians may take exception to the fact that the “handle” in this case is too short and too shallow in proportion to the cup. That is a reasonable protestation on technical grounds. However, the spirit behind the pattern’s typical bullishness remains valid, in our view, and it suggests an eventual breakout.
The post-election “Trump Rally” does not need any more confirmation for purposes of its “validation”. The emphatic new highs in many segments of the market, from small-caps to large-caps, speak for themselves. However, if the NYSE Composite is indeed able to break out to new all-time highs, it would be another feather in the cap for this market. And as with the Value Line Composite, it would certainly mean more than Dow 20,000.
_____________
More from Dana Lyons, JLFMI and My401kPro.
The commentary included in this blog is provided for informational purposes only. It does not constitute a recommendation to invest in any specific investment product or service. Proper due diligence should be performed before investing in any investment vehicle. There is a risk of loss involved in all investments.


