DuPont Cooking Up An Epic Breakout?

The stock of DuPont may be putting the finishing touches on a multi-decade cup-and-handle formation.
In yesterday’s post on the not-quite-new high in the NYSE Composite, we suggested the possible interpretation of a “cup-&-handle” formation on its chart. As we discussed in the post as well as others in the past, a cup-&-handle is considered to be a bullish pattern suggestive of an eventual breakout. To reiterate our description of the pattern from yesterday:
The Cup: This phase includes an initial high on the left side of a chart followed by a relatively long, often-rounded retrenchment before a return to the initial high.
The Handle: This phase involves a shorter, shallower dip in the security and subsequent recovery to the prior highs.
The bullish theory is predicated on the idea that after taking a long time for a stock to return to its initial high during the “cup” phase, the “handle” phase is much briefer and shallower. This theoretically indicates an increased eagerness on the part of investors to buy since they did not allow it to pull back nearly as long or as deep as occurred in the cup phase. Regardless of the theory, the chart pattern has often been effective in forecasting an eventual breakout and advance above the former highs.
We bring up the pattern again as it applies to today’s Chart Of The Day on the stock of DuPont (DD). That’s because a long-term look at the conglomerate’s price chart reveals a potential super-sized cup-&-handle.
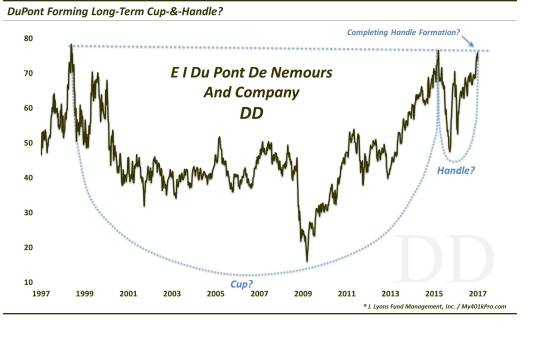
In yesterday’s post on the NYSE, some technicians took exception to the fact that the “handle” was too short and/or too shallow in proportion to the cup. As we mentioned, that is a reasonable protestation. In the case of DuPont, the handle is more proportionate based on a traditional interpretation of the pattern.
Specifically, the “cup” portion of the pattern spans from DD’s 1998 high in the upper 70′s, through its 18-year trough which bottomed at 15 in 2009, and to its eventual March 2015 return to the upper 70′s level. The “handle” portion covers the dip
from March 2015 down to 47 and its recovery back to the highs in December 2016. At just shy of 50% of the cup depth, the handle characteristics aligns better with a textbook cup-and-handle.
At this point, all that is left is for the stock to break out to new highs finally. It it does, and if the cup-and-handle interpretation is correct, the resulting rally could be tremendous
(up to 100-140?)
based on the magnitude and duration of the cup-&-handle pattern.
_____________
More from Dana Lyons, JLFMI and My401kPro.
The commentary included in this blog is provided for informational purposes only. It does not constitute a recommendation to invest in any specific investment product or service. Proper due diligence should be performed before investing in any investment vehicle. There is a risk of loss involved in all investments.


