Hang Seng Hitting A Hurdle?

Hong Kong’s Hang Seng Index is bumping into potential technical resistance.
Of the scores of global equity indices we track, perhaps the most boring has been the Hong Kong Hang Seng Index. That includes the past 12 months as well as during this decade. Over the past 7 years, the index is almost literally unchanged. In 2010, it opened the year trading at 21,860. Its opening print in 2017 was 21,993. More recently, it hasn’t been much more exciting as it is essentially unchanged over the past 5 and 15 months as well.
In the spring of 2015 (probably the last time we deemed the index “post-worthy”), the Hang Seng did cause some ripples by shooting sharply above its 6-year highs. The breakout would fail spectacularly, however, and the index would subsequently plummet to 4-year lows in the global equity rout culminating in February 2016. And while the action in the Hang Seng since has been quite mundane, those two events do make for some noteworthy reference points.
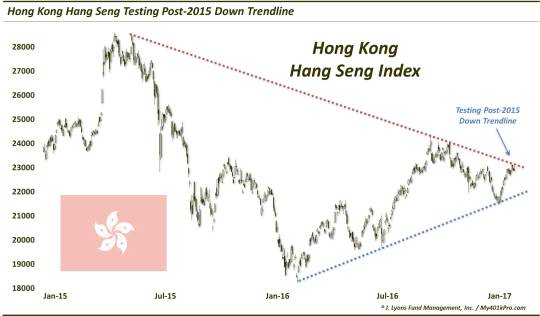
Specifically, the high in May 2015 and the low in February 2016 mark the origins of 2 converging trendlines that form a symmetrical triangle, or pennant, on the Hang Seng’s chart. The post-May 2015 Down trendline connects the highs in September-October of last year while the post-February 2016 Up trendline connects the June and December 2016 lows.
The reason we bring it up now is because the Hang Seng is now testing once again the post-2015 Down trendline, around 23,000. This could serve as resistance in the immediate-term for Hong Kong stocks.
Now, this is hardly the most important or thought-provoking chart we’ve ever posted. But it does illustrate what appears to presently be the dominant technical determinant of prices for the Hang Seng. And it does lay out the potential determining factor of the next directional move in prices. Specifically, whichever way this pennant breaks – up or down – technical textbooks would tell us to expect prices to continue in that direction over the foreseeable future.
Plus, such a break may actually liberate the index from its bout of boringness.
_____________
More from Dana Lyons, JLFMI and My401kPro.
The commentary included in this blog is provided for informational purposes only. It does not constitute a recommendation to invest in any specific investment product or service. Proper due diligence should be performed before investing in any investment vehicle. There is a risk of loss involved in all investments.