
Does Stocks’ Buoyant January Mean Smooth Sailing For 2017?

The S&P 500 never traded below its 2016 closing price during January; prior such cases have been very positive harbingers…mostly.
January was an exceptionally placid month in the stock market. With the various year-end/new year dynamics that are often at play, it is typical to see an uptick in volatility during the first month of the year. The opposite was true this year, however. As many observers have mentioned, the January trading range in the S&P 500 was the tightest in decades. Given the stream of political headlines in recent weeks, that might surprise a lot of people. It should also be instructive regarding the impact of news flow on the markets, i.e., tune it out.
Another interesting aspect of January’s action in the market is that, at least as measured by the S&P 500, stocks never traded negative year-to-date (or month-to-date) during the month. In other words, the S&P 500 never dipped below its 2016 closing price of 2238.83. That got us searching the history books.
According to our data, since the inception of the index in 1950, there have been just 6 other years in which its price never went negative year-to-date during January:
1951
1958
1975
1987
2012
2013
2017
Now, despite this rare phenomenon – not to mention the already significant focus on the stock market’s performance during January as it relates to the rest of the year – we are not going to base our investment decisions over the balance of the year based on what occurred this past month. However, as always, we were of course curious to see how the market performed following the prior 6 occurrences. As it turns out, it was very positive, for the most part.
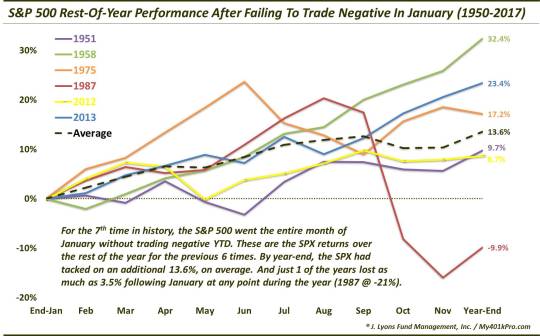
This chart shows the post-January monthly performance through the end of the year for each of the 6 precedents, as well as the average of the years:
Here is the year-end performance in table format:
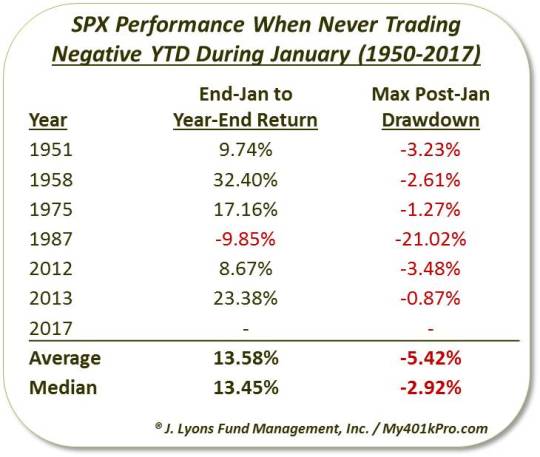
As one can see, most of the rest-of-year performance in the S&P 500 was sparkling during these years. 5 of the 6 showed positive returns from the end of January through year-end, at an average of +13.58% and a minimum of +8.67%. Furthermore, the drawdowns from the January close through the end of the year were minuscule, at a median of -2.92%. Just one year saw a drop of even 3.5% below January’s closing price at any point during the remainder of the year.
So, about that one exception to the positive performance. As many readers likely spotted in the original list of historical yearly precedents, the fly in the ointment was 1987. Of course, the October crash that year put a hurt on the stock market. The result was a 21% drawdown from its January close (and a 35% drop from its August highs). The January-end to year-end loss ended up being nearly -10%. That said, prior to the crash, the S&P 500 was able to tack on about 23% from its January close into its August high. And 1987 actually had the best returns through July and August of any of the 6 years.
As we said, we are not going to put much stock into this study in terms of charting our investment course for the rest of the year. The limited sample size is an issue, not to mention we are not into forecasting, per se. We will instead, as always,
monitor market data and developments as they unfold throughout the year. However, despite the limited precedents, given the overwhelmingly positive and consistent performance among the previous occurrences, it does make for a compelling data point. At a minimum, it appears to at least be another gentle breeze at the backs of the bulls.
________
More from Dana Lyons, JLFMI and My401kPro.
The commentary included in this blog is provided for informational purposes only. It does not constitute a recommendation to invest in any specific investment product or service. Proper due diligence should be performed before investing in any investment vehicle. There is a risk of loss involved in all investments.

