
Is This Overlooked Statistic Signaling Investor Complacency?
The number of unchanged issues on the NYSE has spiked, often a sign of complacency among investors.
While the price structure and breadth in the stock market remain solid and supportive of higher prices, one area of concern that we have been noting is investor sentiment. Specifically, it is too complacent for our liking. Investors and traders seem to be outright dismissing the notion of risk in the stock market. And while extreme bullishness can persist for awhile, it usually ends up being mis-guided, eventually. One potential piece of evidence of complacency comes from a surprising, and typically overlooked, statistic: unchanged issues.
As opposed to advancing or declining issues, unchanged issues are those that close a particular day at the same price at which they closed the day before. Historically, we have found that, for whatever reason, elevated numbers of unchanged issues often occur near market tops of varying significance. This indifference towards large numbers of shares may be a signal of investor complacency during low-volatility, up-trending markets, i.e., out of sight out of mind. Conversely, low levels of unchanged issues are often emblematic of market bottoms as perhaps elevated levels of fear and awareness create a greater impetus to trade stocks.
Presently, it is the former case, i.e., elevated numbers of unchanged issues, that is relevant. In fact, as our Chart Of The Day reveals, yesterday saw the highest percentage of unchanged issues on the NYSE since 2003, and one of the highest readings since the move to decimalization.
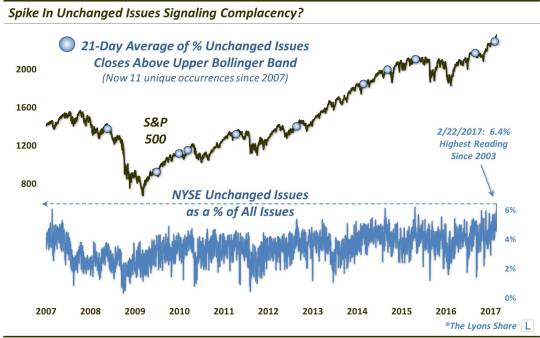
This was not on 1-day wonder either. Unchanged issues on the NYSE have been elevated for some time now. The 21-day (i.e., 1-month) moving average of unchanged issues is also at its highest level since the beginning of 2004. Additionally, this places the series above its upper Bollinger Band on a 200-day lookback period for just the 11th unique time since 2007. The markers on the chart display the initial readings among the 11 occurrences.
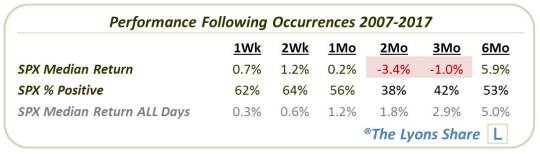
As the chart, and the table below, reveal, such elevated readings are not necessarily an immediate problem. Frequently, they have led to further gains for the S&P 500 in the very short-term. However,
those gains were most often eventually erased as the signals consistently lead to sub-par intermediate-term returns.
Will the present case lead to trouble? We cannot know for sure. However, given additional concerns regarding investor sentiment, it would not surprise us to see this signal eventually lead to a hiccup in this ongoing obstinate rally. And while further gains are certainly possible before potential trouble hits, it is important to note that it has now been 2 weeks since the extreme threshold was first breached. Thus, a wake up call may come sooner than later.
_____________

Like our charts and research? Get an all-access pass to our complete macro market analysis in The Lyons Share Premium (plus, sign up by February 28 to take advantage of our special launch deal).
Disclaimer: JLFMI’s actual investment decisions are based on our proprietary models. The conclusions based on the study in this letter may or may not be consistent with JLFMI’s actual investment posture at any given time. Additionally, the commentary provided here is for informational purposes only and should not be taken as a recommendation to invest in any specific securities or according to any specific methodologies. Proper due diligence should be performed before investing in any investment vehicle. There is a risk of loss involved in all investments.


