
The “Other” Dow Theory Is Waving A Red Flag

While the Dow Industrials remain near all-time highs, the Utilities are well off of their highs; this has signaled trouble in the past.
Back in May 2015, we wrote a series of posts on divergences in the equity market. The series was partially inspired by the considerable attention being paid to the prevailing divergence between the Dow Jones Industrial Average (DJIA) and the Dow Transportation Average (DJT). Of course, the relationship between those 2 indices form the basis of the popular “Dow Theory”. And while there are multiple stipulations to the Dow Theory, its crux is based on the confirmation or divergence between the 2 indices. And the failure at that time of the DJT to confirm the new high in the DJIA was concerning some market observers.
Upon a study of the
historical
relationship between the 2 indices, our assessment was that the Dow Theory, or at least that part of it, was a bit overrated. It’s not that it was wholly irrelevant. Indeed there were multiple examples of divergences signaling major cyclical tops in the markets. And, in fact, that May 2015 occasion marked a significant intermediate-term top prior to the considerable market weakness over the subsequent eight months. However, we found the divergences to be just too unreliable as a market signal.
On the other hand, there were other divergences occurring at the time that we felt were more worthy of investors’ concern. One such divergence dealt with the sister index of the DJIA and DJT, i.e., the Dow Jones Utility Average (DJU) (as an aside, for all you Dow Theory disciples, we are not applying the actual Dow Theory rules to the DJU, just the divergence statistics). The DJU was also badly diverging at the time and since we had similar historical data as the DJIA and DJT, we thought we would take a look at those such divergences. As it turns out, large divergences of the Utilities historically demonstrated much more reliability as a harbinger of trouble than the Transports, according to our study.
We bring this up today because while the DJIA continues to hang up near its highs, the DJU is once again diverging, sitting well off of its 52-week highs. Thus, we revisited the 2015 post and updated the divergence study. Specifically, we looked for any time that the DJIA traded at a 52-week high while the DJU was at least 10% below its own high. Since 1943, there have been 73 days matching this criteria (many of the dates fell in clusters; though the clusters were of similar numbers of days so we included all such days).
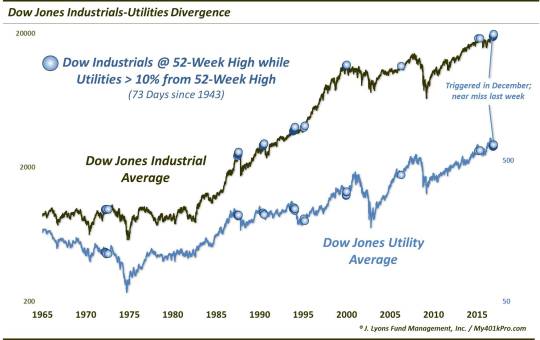
We will note that at last week’s DJIA 52-week high, the DJU was 9.4% below its high so it barely missed meeting this criteria. However, there were numerous occurrences in November and December that qualified. And once again, if recent history is any guide, this might be a problem down the road because the performance of the indices following such divergences has not been good (FYI, by “recent”, we mean since 1943; such divergences prior to that were not as damaging.):
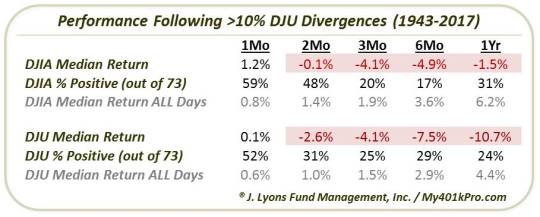
As the table shows, in the intermediate-term following these divergences, returns on both the DJIA and the DJU were exceptionally weak. After 3 months, the DJIA was lower by a median -4.1%, with 80% of the occurrences showing losses. The DJU was also down a median of -4.1% after 3 months, with 75% losers. 6 months after the events, median returns were even worse for the DJIA and DJU at -4.9% and -7.5%, respectively. And even out to 12 months, the majority of these divergences saw both indices lower.
So while the recent simultaneous, confirming highs in the Dow Industrials and Transports has Dow Theorists quite bullish at the moment, the lesser-watched relationship between the DJIA and the Utilities is not quite so positive. Will this divergence be a sign of trouble again this time? There are no guarantees. However, if the historical pattern holds true, we can expect the weakness to begin soon as it has been over a month since the November-December occurrences.
_____________
“diffuse station” photo by Hope Abrams.
More from Dana Lyons, JLFMI and My401kPro.
The commentary included in this blog is provided for informational purposes only. It does not constitute a recommendation to invest in any specific investment product or service. Proper due diligence should be performed before investing in any investment vehicle. There is a risk of loss involved in all investments.


