Has Stock Rally Reached Its Speed Limit?
The Dow is presently hitting the upper bound of its post-2009 bull market.
Given today’s Fed-juiced stock market rally, Wednesday’s Chart Of The Day seems rather appropriate (not to mention it is #TrendlineWednesday!). Over the course of its, now 8-year, cyclical bull market, the Dow Jones Industrial Average (DJIA) has traveled within a rising trend channel. That merely means that prices have been contained between two similarly-sloped rising trendlines. It certainly is not uncommon for a security or index to rise at a consistent pace such that its periodic troughs find support at the same upward-sloping trendline below it. It is somewhat unusual, however, for prices to maintain such a slope for as lengthy a period as 8 years.
It is especially unusual for a price series to maintain the pace of its rise for 8 years such that its periodic peaks also reached a constant sloping uptrend line above it. To accomplish such a feat, prices essentially need to overcome the forces of gravity, from a price and time standpoint. Typically, that pace of advance is only seen in true, parabolic bubble-type scenarios.
Yet, that is exactly what the DJIA has achieved, even up to the present time.
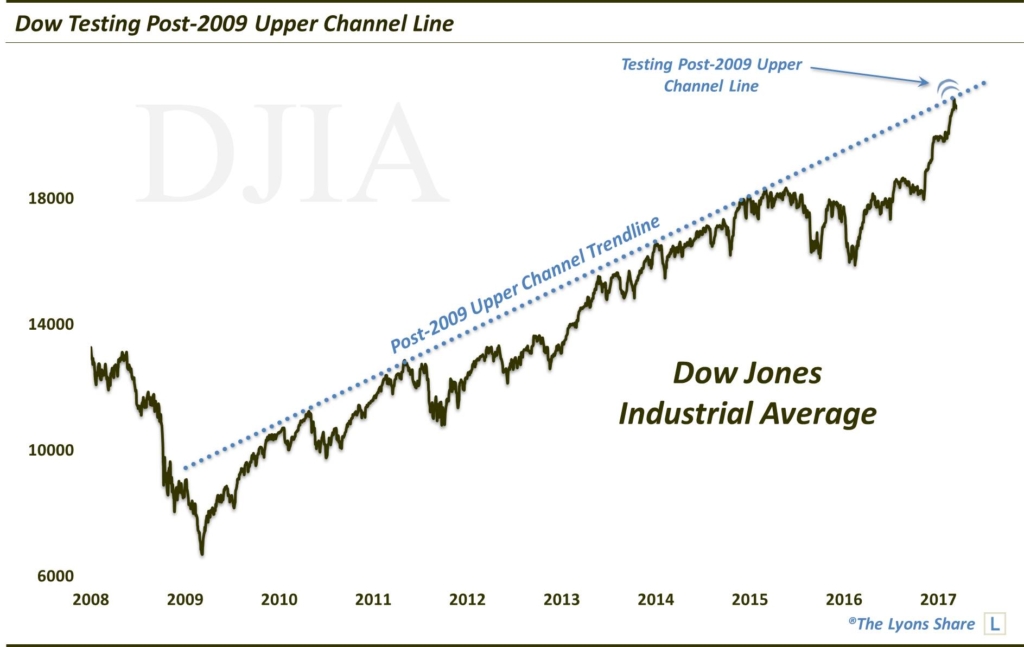
As the chart shows, as recently as the March 1 post-SOTU blast higher, the DJIA has found resistance at the same upward-sloping trendline that has consistently marked the top of its rising channel over the past 8 years. The index bumped down off of the line in 2010, 2011, 2013, 2014 and 2015. Its 2017 return to that line is a testament to the truly explosive nature of the post-election rally.
To clarify, when we say resistance, we don’t mean to imply that the line has prevented the DJIA from making any further upside progress. Obviously, the index has continued to climb higher, eventually, after each of the upper channel line touches. However, the line has served as a consistent limit to the DJIA’s pace of advance. To expect prices to accelerate above the line is essentially to expect the index to go into full-on parabolic mode. We do not anticipate that.
Many vehicles, from go-carts and golf carts, to heavy trucks and construction equipment have a device on their engine called a “governor” that limits the top speed that the vehicle can attain. Similarly, while this upper channel line on the DJIA may not put a halt to the rally, it may serve as a governor in limiting its pace of advance.
_____________
Like our charts and research? Get an All-Access pass to our complete macro market analysis, every day, at our new site, The Lyons Share .
Disclaimer: JLFMI’s actual investment decisions are based on our proprietary models. The conclusions based on the study in this letter may or may not be consistent with JLFMI’s actual investment posture at any given time. Additionally, the commentary provided here is for informational purposes only and should not be taken as a recommendation to invest in any specific securities or according to any specific methodologies. Proper due diligence should be performed before investing in any investment vehicle. There is a risk of loss involved in all investments.