
S&P 500 AND Short-Term VIX Drop: Who Blinks? (PREMIUM-UNLOCKED)
On February 16, we noted the strange occurrence in which the VIX jumped >4% on a day in which the S&P 500 closed at an all-time high. As the 2 typically move in opposite directions, we wondered if one of them would “blink”. A historical study into similar days suggested that the S&P 500 would blink, i.e., that the VIX was the one that was “right”. As it turns out, it was the VIX that blinked, as the S&P 500 would continue rising an additional ~3% over the next few weeks.
Yesterday, we saw the opposite scenario, in which the S&P 500 dropped sharply (at least in recent terms: -0.6%) while the 9-day VIX (VXST) also dropped sharply, over 9%. So which one will blink this time?
Here are the previous 8 times since the VXST inception in 2011 that the S&P 500 dropped >0.5% while the VXST simultaneously dropped >5%.
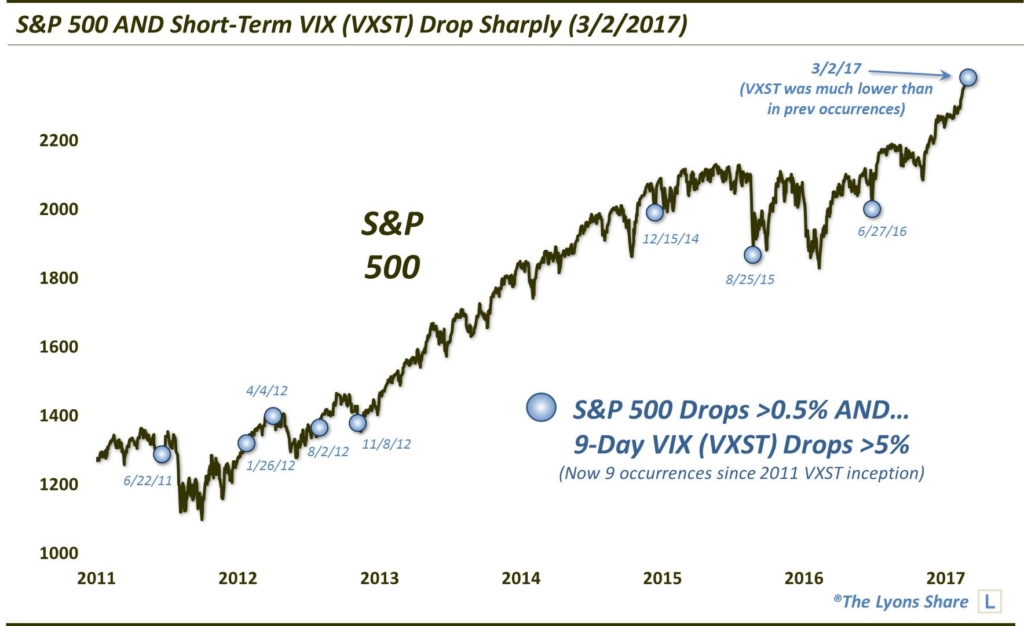
Here are the dates of the events:
6/22/2011
1/26/2012
4/4/2012
8/2/2012
11/8/2012
12/15/2014
8/25/2015
6/27/2016
3/2/2017
Here are the aggregate returns in the S&P 500 following these occurrences:
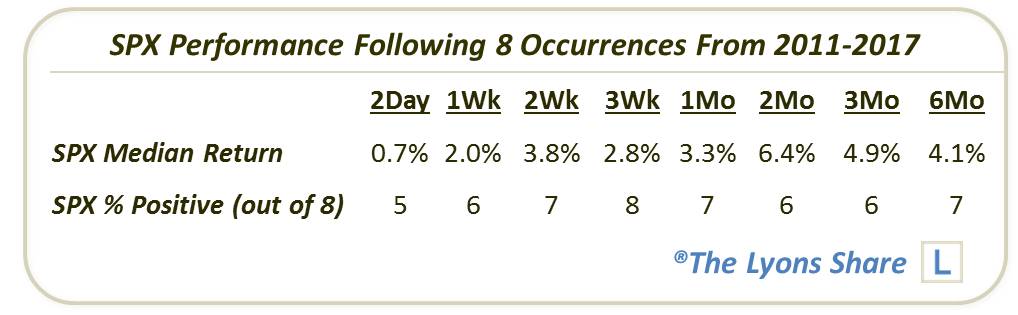
Before you get too giddy about the signal, however, consider this. Yesterday, the VXST closed at 9.6, near all-time lows. The prior occurrences (mostly) occurred after stock weakness had already sent the VXST considerably higher. Thus, the drop was to relieve some of the over-extended nature of the VXST. Specifically, in the prior 8 occurrences, the VXST averaged over 21. The only date with a VXST lower than 16 was 4/4/2012, which was also the only date that saw consistent weakness in the S&P 500 out to 3 months afterward.
Therefore, given the 9.6 reading in the VXST, and given that the S&P 500 is one day off of an all-time high, we would not read anything into the prior positive historical returns.

