Record “Close But No Cigar” Streak For Stocks
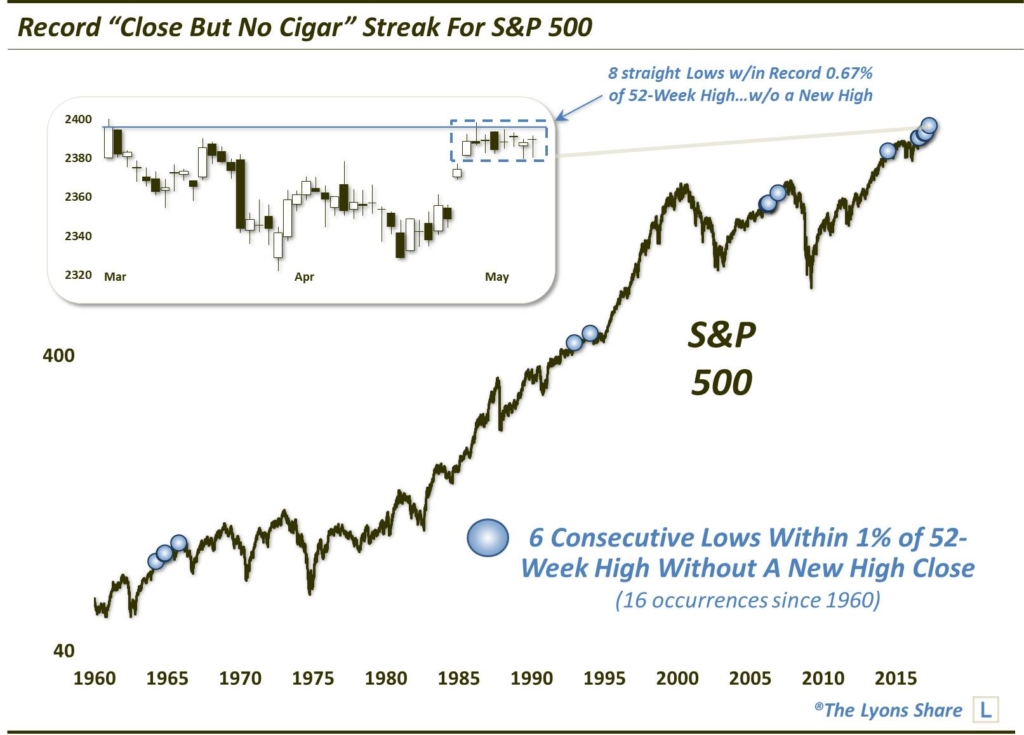
Over the past 8 days, the S&P 500 has been closer to a 52-week high, without achieving one, than any other stretch in its history.
It seems like the typical trading pattern for U.S. stocks over the past 10 months has been 1) a sharp, quick burst higher, followed by 2) an extended listless (or lifeless) stretch of time. The past 2 weeks have provided a good example of this phenomenon. First off, on April 24, the S&P 500 popped higher by more than a percent following the 1st round of the French presidential election, to just beow its all-time high. In the 8 days since, the index has barely even budged – and I mean barely. The total High-Low range over the course of those 8 days is less than 0.8% – well within even the 1-day move on the 24th.
While it has been, so far, unable to score a new high, at least the index’s malaise has not resulted in any material losses. As a matter of fact, when considering the condition that the S&P 500 has failed to make a new high over the past 8 days, the index has actually set a record for the shallowest drawdown in history. In other words, at its lowest point during the past 8 days, the S&P 500 was just 0.67% away from its 52-week high. That is the closest ever over such a stretch, without actually closing at a new 52-week high.
If we expand the parameters a bit, since 1960 (the beginning of our most accurate intra-day data), there have been just 6 other stretches of at least 8 days wherein the lows in the S&P 500 have all been within 1% of an all-time high, without actually recording a new high. Shortening the duration, there have now been a total of 16 such stretches of at least 6 straight days, as shown by the markers in the chart below.
So what should one expect as an outcome to this setup? Arguably, technical analysis would consider most of these tight trading ranges near the highs to be some form of a bull flag, or continuation pattern. That is, they “should” resolve themselves higher via new 52-week highs. And while we never want to anticipate a breakout, our present scenario certainly looks like it would fit that description.
Looking historically, however, the results following the 6-day stretches shown above have been mixed – so mixed, in fact, that it is pointless to even show the aggregate performance. Of the 15 prior, unique occurrences, they are roughly split as to how many saw the streak broken to the downside, i.e., moving more than 1% away from the 52-week high, and to the upside, i.e., the achieving of a new high. That said, there was only 1 occurrence that did not see a new high registered within about a month or so: August 25, 2016.
Another perhaps intuitive hypothesis is that, given the tightly coiled status of prices, these events likely led to big moves, up or down, following their resolution. That would also be false. For all those looking for fireworks following the break of the current range, the historical precedents would not lend any evidence to that expectation. For example, neither the median nor average returns following the 15 prior events exceed even 1%, up or down, for out as long as 3 months. Thus, don’t be surprised if the firework is a dud and the doldrums continue, even after the range is broken.
Lastly, in an interesting, if questionably helpful, observation, it has not been unusual to see series of these signals occur within a relatively short time frame. For example, as shown on the chart, there were 5 occurrences between 1964 and 1965, then none in either the 1970′s or 1980′s. In 2006, we saw 4 occurrences alone. And since this past August, there have now been 5 incidents.
To see these events happen in clusters is not too surprising. It just demonstrates that markets experience periods of unique character, from a micro-trading perspective. Perhaps the only (very loose) similarity we can see between the 2 previous clusters, in the mid-1960′s and 2006, is that the final event of the clusters occurred months prior to significant cyclical tops in the stock market. Again, we are not making a prediction, merely an observation.
About the only conclusion we can come to is that a new high is likely within about a month’s time – but that very well may not put an end to the paint-drying environment we’ve been witnessing.
**This article was written prior to today’s new high close in the S&P 500.**
Like our charts and research? Get an All-Access pass to our complete macro market analysis, including tons of charts and ideas like this EVERY DAY, at our new site, The Lyons Share.
_____________
Disclaimer: JLFMI’s actual investment decisions are based on our proprietary models. The conclusions based on the study in this letter may or may not be consistent with JLFMI’s actual investment posture at any given time. Additionally, the commentary provided here is for informational purposes only and should not be taken as a recommendation to invest in any specific securities or according to any specific methodologies. Proper due diligence should be performed before investing in any investment vehicle. There is a risk of loss involved in all investments.


