
“Ex-CEL In May?”
There is some evidence to suggest that stock investors would be well served by NOT selling in May and going away this year.
One of the most famous of all of Wall Street’s trading bromides is “Sell In May & Go Away”. Of course, the saying refers to the tendency of stocks to perform worse during the 6 months from May through October than they do from November through April. Perhaps the reason why it is still so popular is that, unlike some of Wall Street’s other sayings, there is actually solid historical evidence to back it up, including recent history.
Specifically, here are the average returns in the Dow Jones Industrial Average during the 2 periods since 1900:
November-April: +5.45%
May-October: +1.61%
Not only does the average return for the May-October period lag badly, but the consistency of positive returns has been much less reliable:
November-April: 69% Positive Returns
May-October: 61% Positive Returns
Plus, as mentioned, unlike many seasonal tendencies that lose their effectiveness over time as the edge gets arbitraged away, the Sell In May pattern has held true even as of late. For example, 6 of the last 7 years, 10 of the last 12 years and 18 of the last 23 years saw the Dow stronger from November-April than from May-October.
So is there any thing that bulls can hang their hat on during the forthcoming 6 months? Well, first of all, despite the fact that May-October has generally lagged its 6-month counterpart, the historical average return for the period is still positive. So it’s not like the whole period has been a disaster, though there have certainly been some of those.
In parsing the data, however, we have found one historical trend that may actually encourage traders to stay invested during this year’s May-October period, rather than the mere expectation that their investments will just be biding their time. It is based on the performance of the just completed November-April period – specifically, the Dow’s strong (but not too strong) +15.4% performance.
Here’s what we mean. We again went back to 1900 and measured the return in the Dow during every November-April period. We then broke the returns down by those less than -15%, those greater than 20% and all 5% intervals in between. We then looked at the subsequent May-October periods to see if there was any correlation.
As it turns out, negative November-April returns had a strong tendency to lead to negative May-October returns (except for the very worst years which typically saw mean reversion). Conversely, positive November-April returns had a strong tendency to lead to positive May-October returns. And the historical sweet spot for May-October periods came following November-April returns ranging between 15%-20%, e.g., this year.
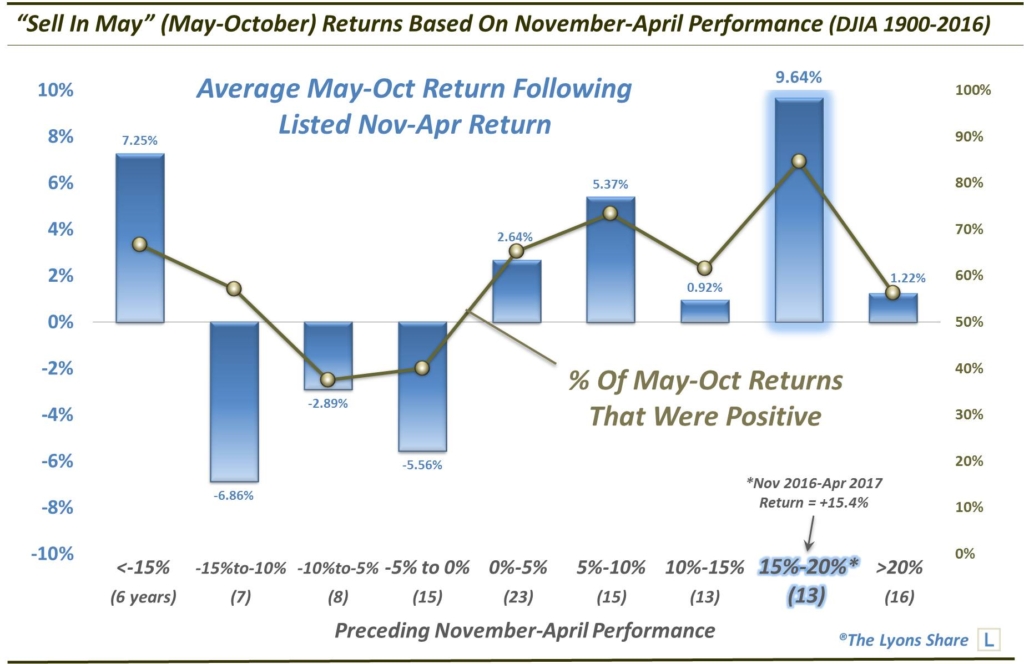
As the chart reveals, following the 13 November-April periods with returns between 15%-20%, the average May-October return has been +9.64%. That, again, compares with an average return during all May-October periods of just 1.61%. Furthermore, 11 of the 13 years saw positive returns from May through October.
Now, there are no guarantees in financial markets. As recently as 2011 saw this tendency fail when the Dow lost 6.7% during the May-October period (with a drawdown that was much worse) following a November-April period that gained more than 15%. Furthermore, who’s to say these returns aren’t just completely random anyway?
We will say that this seasonal tendency is far down on the list of decision-makers for us as it pertains to these upcoming 6 months. We have our models and indicators that we track which, as always, will guide our investment posture. That said, given the negative ink paid toward the “Sell In May” period (and deservedly so), at least this is some evidence to suggest that, for this year, stocks could instead Excel In May.
Like our charts and research? Get an All-Access pass to our complete macro market analysis, including tons of charts and ideas like this EVERY DAY, as a premium member of The Lyons Share.
_____________
Disclaimer: JLFMI’s actual investment decisions are based on our proprietary models. The conclusions based on the study in this letter may or may not be consistent with JLFMI’s actual investment posture at any given time. Additionally, the commentary provided here is for informational purposes only and should not be taken as a recommendation to invest in any specific securities or according to any specific methodologies. Proper due diligence should be performed before investing in any investment vehicle. There is a risk of loss involved in all investments.


