
Weighing The Evidence In Market Breadth
A look at the Equal Weight S&P 500 has something for both the bulls and the bears.
A hot, and much debated, topic of late in equity market circles is the issue of market breadth. As a refresher, breadth refers to the level of participation among all stocks in the market, i.e., how many stocks are advancing vs. declining. Many market watchers contend that breadth is an important component when determining the well being of the stock market at a given time. Indeed, various, measures of breadth form the bedrock of our own intermediate-term risk model. After nearly 50 years of observing, we firmly believe that an accurate assessment of the market’s internals, or breadth, is key in determining the true state of health of the broad stock market. Specifically, we view a relatively large number of advancing stocks (i.e., good participation) as desirable, and often mandatory, when considering a healthy, sustainable rally.
The challenge therein is selecting the right measures, and accurately interpreting said measures. That’s because there are about as many ways of measuring the level of stock participation in the market as there are stocks in the market. That’s why the breadth issue has been such a hotly debated topic of late. A solid case can be made in favor of good breadth presently (e.g., A-D Lines at highs, broad indices near highs, etc.) or against it (e.g., non-confirmation of stocks above moving averages, waning relative performance among equally-weighted averages, etc.).
Where do we stand? We certainly see signs of waning breadth, most importantly among some of our key proprietary indicators. However, we don’t yet observe the dangerous “thinning” conditions that can threaten the long-term stability of the market.
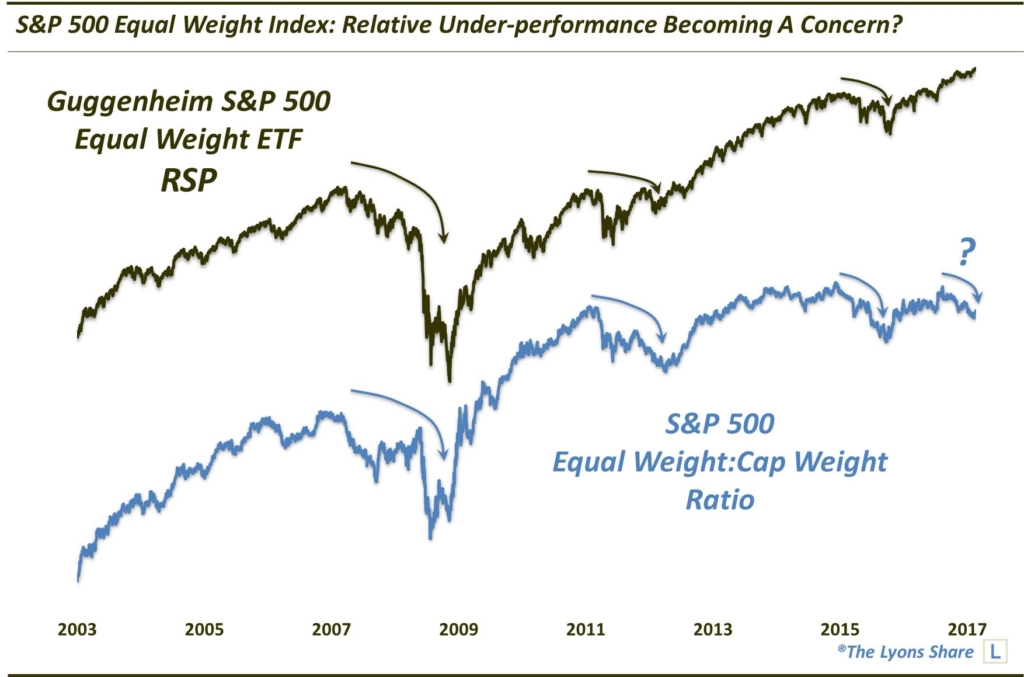
In this post, we’re going to look at a couple angles pertaining to one of the aforementioned equally-weighted averages. Specifically, it is the Guggenheim S&P 500 Equal Weight ETF, ticker, RSP. As the name implies, an equal-weight average weighs each of the components the same. This is in contrast to popular cap-weighted averages, like the S&P 500, which place more weight on larger stocks. Cap-weighted averages can give one a distorted view of the health of the broad market at times if they are being unduly influenced by a relatively few number of stocks. On the other hand, an equally-weighted index can give us a better sense of the level of participation across the entire index.
Here, we look at a few of the pros and cons that we see presently in the equal-weight S&P 500 (RSP)
Pro
As recently as Tuesday, the RSP closed at an all-time high. Contrary to what anyone might tell you, an all-time high is not a bearish condition.
Con
Despite the all-time high, on a relative basis, the RSP has been trending lower vs. its cap-weighted counterpart since early December. This may be a concern given what we said about good participation been a required condition for a sustainable rally. Indeed, since the inception of the RSP in 2003, the stock market has tended to struggle when the ratio of the equal-weight RSP was trending lower vs. the cap-weighted S&P 500.
Maybe Con
You see us write often about the Fibonacci sequence, a mathematical series of numbers representative of repeated patterns in all walks of life, including financial markets. Typically, it is terms of Fibonacci Retracements, i.e., the magnitude of counter-trend moves consistently exhibited by market prices. We have also found the sequence useful in Fibonacci Extensions. These describe the magnitude of “extensions” often exhibited following complete reversals of market moves. For example, the RSP is presently hitting key Fibonacci Extensions following reversals of prominent declines over the past few years. Namely, they are the 161.8% Fibonacci Extension of the 2015-2016 decline and the 261.8% Fibonacci Extension of the August-November 2016 decline.
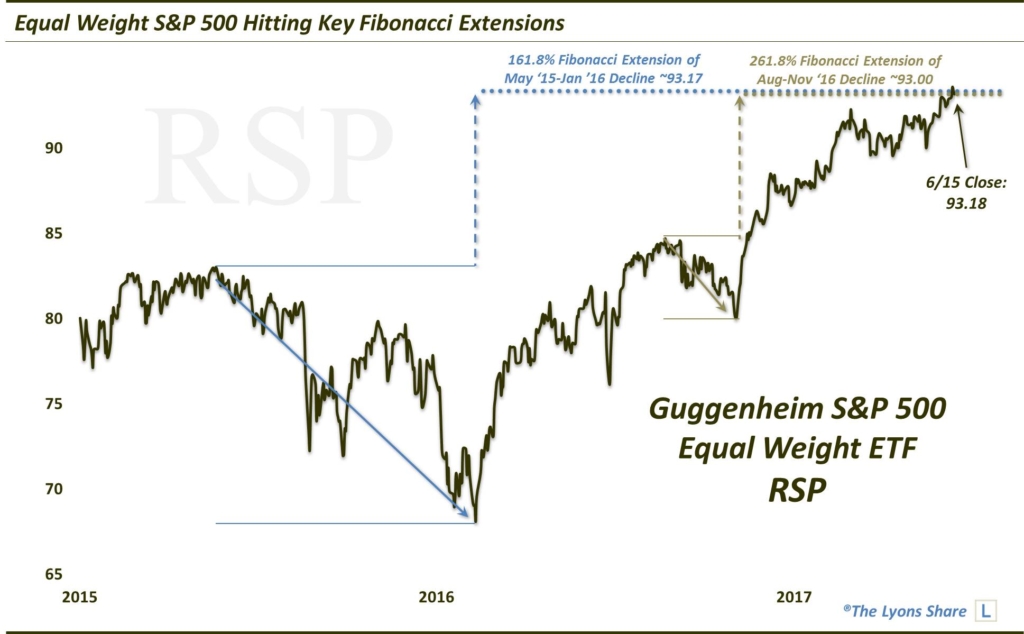
Now, these Extensions aren’t foolproof. That is, they are not guaranteed to stop the RSP in its tracks. However, we have found this tool reliable enough to be useful in practice, and to be a genuine concern in this situation. And we have found these Extensions, like Retracements, to be particularly effective when clustered together as these two are here.
So, there you have an analysis of current market breadth from the viewpoint of the equal weight S&P 500 Index. It is by no means an exhaustive look at the index, or certainly breadth in general. Like we said, there are untold numbers of ways to assess market breadth. Even, in the case of the RSP, there are numerous ways to assess its situation.
What is our conclusion? From the angles we looked at, like our more extensive assessment of the market’s internals, we don’t feel that a concrete conclusion can confidently be made either way. There are legitimate concerns, but certainly enough positives to consider as well. The best we can say is that the situation needs to continue to be monitored.
It is also a helpful reminder to always keep an open mind about potential market outcomes — and to always consider the weight of all the evidence in one’s assessment.
If you want the “all-access” version of our charts and research, we invite you to please check out our new site, The Lyons Share.
_____________
Disclaimer: JLFMI’s actual investment decisions are based on our proprietary models. The conclusions based on the study in this letter may or may not be consistent with JLFMI’s actual investment posture at any given time. Additionally, the commentary provided here is for informational purposes only and should not be taken as a recommendation to invest in any specific securities or according to any specific methodologies. Proper due diligence should be performed before investing in any investment vehicle. There is a risk of loss involved in all investments.


