Unlucky (Year) Number 7?
The 2nd half of years ending in “7″ have historically exhibited the stock market’s worst semi-annual performance.
Seasonality in stock investing is a tricky thing. In one way, some of the most profitable and a reliable timing systems are those which depend only upon seasonality. On the other hand, emotionally and rationally, they are extraordinarily difficult to implement, at least exclusively.
For example, if you only invest during the traditionally strong November-April period and it does not work out, you have to wait another six months before trying to make your money back. Or, if you invest during the third year of the presidential cycle due to its overwhelmingly positive historical returns, and you lose money, you have to wait another three years to try it again. Worse still, if you buy stocks during a year ending in “5” because such years have been profitable for the past 130 years, and the market goes down, you have to wait another decade before trying it again.
That is why we treat seasonality as either a minor headwind or tailwind with which to tweak our investment posture. Again, however, some of the historical seasonality trends are so compelling that, at a minimum, they command our acknowledgment.
Consider, for instance, another trend along the same lines as the 3rd example mentioned above. Given our current year “2017”, we were recently pondering the unfortunate fate that has befallen the stock market during the most recent years ending in a “7”. There was the market top of 2007, the Asian crisis in 1997 and the crash of 1987. It got us wondering if this was just some recent fluke – or if there really was a sort of a curse around “7” years. So we got out our history books (i.e., we scrolled to the left on our chart of the Dow Jones Industrial Average) to check previous “7” years going back to 1900. As it turns out, 7 does indeed appear to be quite unlucky.
Consider the track record for the back half of “7″ years:
- 2007: “Just” a 10% drawdown, but also a cyclical market top
- 1997: Asian Crisis…swift 17% drawdown
- 1987: “The Crash”…20% decline, with a 41% drawdown
- 1977: Cyclical bear market…9% decline, with a 15% drawdown
- 1967: Up 5% for half, but 12% drawdown, all in the 4th quarter
- 1957: Straight down from July…13% loss, with 20% drawdown
- 1947: Mostly unscathed…2% gain, with ”just” a 7% drawdown
- 1937: Major bear market…Down 29% with 41% drawdown
- 1927: Roaring bull…9% drawdown, but a gain of 21%
- 1917: Cyclical bear market…22% decline, with a 31% drawdown
- 1907: Cyclical bear market…24% decline, with a 35% drawdown
So, at first blush the track record looks pretty lousy. But is it any worse than most semi-annual periods? Yes.
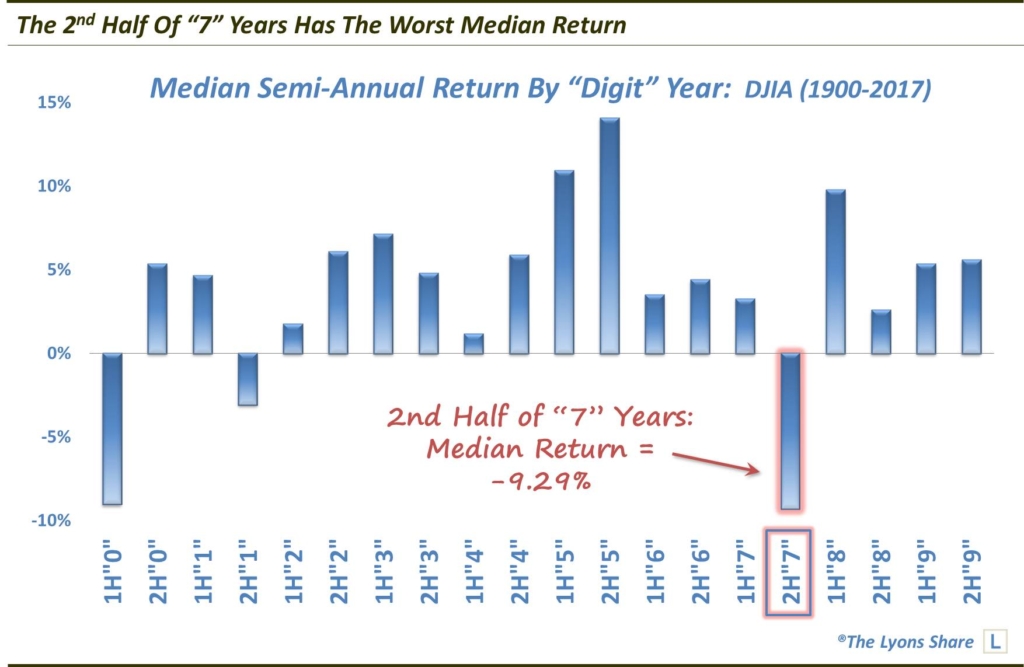
Here are median returns for all half years based on their ending digit.

At -9.29%, the 2nd half of “7″ years has the worst median return of all half years. In fact, it is one of just 3 halves with negative median returns, along with the 1st half of “0″ years and the 2nd half of “1″ years. And other than the 1st half of year “0″, the median return of the 2nd half of year “7″’s is over 600 basis points worse than any other half year.
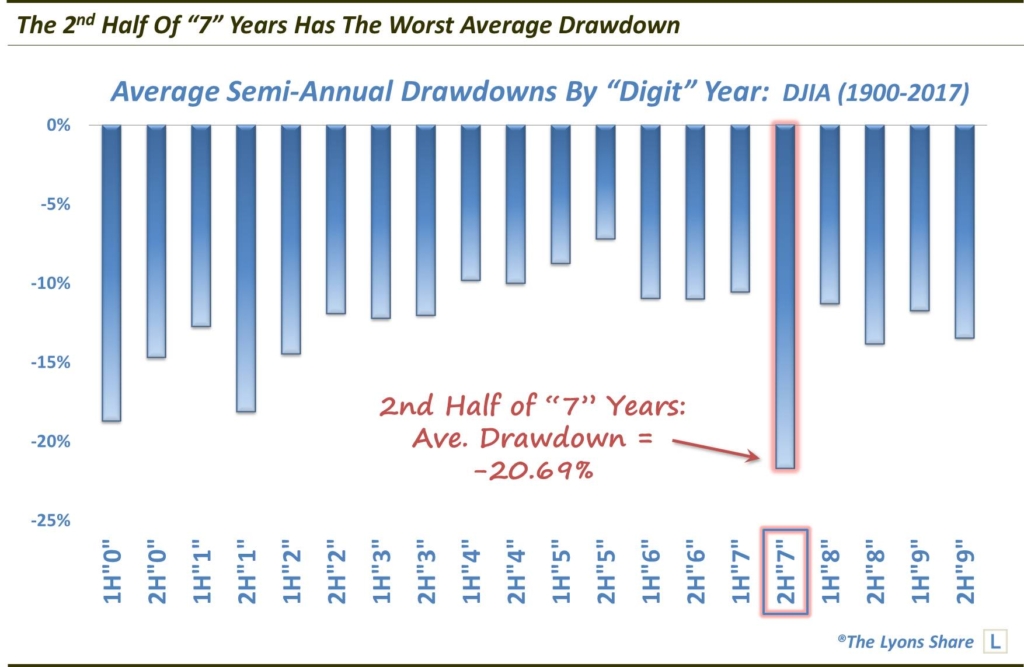
Looking at drawdowns, the picture is just as bad.

On average, the 2nd half of year “7″ has experienced a drawdown of more than -20%, much worse than any other half year (FYI, the median drawdown in the 1st half of year “0″ is worse than that of the 2nd half of year “7″, -19.51% vs. -16.83%).
Thus, when we were pondering the rough ride that stocks have suffered over the past several “7″ years, its historical track record is actually even worse. Again, while we are not about to construct a trading system based on this data point, considering the overwhelming evidence, it does at least have our attention.
So, while the stock market remains in an uptrend, and hitting new highs in some cases, we do have an open mind that it may get “unlucky” at some point in the back half of this year.
If you want this “all-access” version of our charts and research, we invite you to check out our new site, The Lyons Share. Thanks for reading!
_____________
Disclaimer: JLFMI’s actual investment decisions are based on our proprietary models. The conclusions based on the study in this letter may or may not be consistent with JLFMI’s actual investment posture at any given time. Additionally, the commentary provided here is for informational purposes only and should not be taken as a recommendation to invest in any specific securities or according to any specific methodologies. Proper due diligence should be performed before investing in any investment vehicle. There is a risk of loss involved in all investments.


5 Comments