
Are Investors Running Out Of Cash?
One survey finds the lowest investor cash position since the stock market top in 2000.
We used to post a lot of these scary secular charts pertaining to long-term market related concerns. These charts pointed to conditions that, sooner or later, are bound to come home to roost. We were especially active peddlers in 2015 and back in 2012 when it appeared to us as if conditions were ripe for a potential cyclical stock market top, ala, 2000 or 2007. Of course, while the market did experience some turbulence during those times, a cyclical top obviously did not transpire.
With longer-term damage averted, market conditions improved following and in between those periods, opening the way for some of the sharp rallies we’ve experienced in recent years. And with those improved conditions, the immediate relevance of some of the longer-term concerns that we’ve long been monitoring greatly subsided. I don’t care how ominous stock valuations, for example, may be if the market is firing on all cylinders as it has been for much of the past 15 months.
Accordingly, our interest in posting such gloomy long-term charts also subsided during those periods. We are, after all, not interested in gratuitous fear-mongering — we are interested in helping investors make, or save, money.
What we do know is that these adverse long-term conditions have not gone away, and indeed have become more troublesome in some cases. Therefore, at some point, they will necessarily see their day of reckoning. As such, eventually they will assume relevance again within the marketplace discussion. We cannot be certain when that will be, but when we see statistics like the following, our antennae certainly gets raised some.
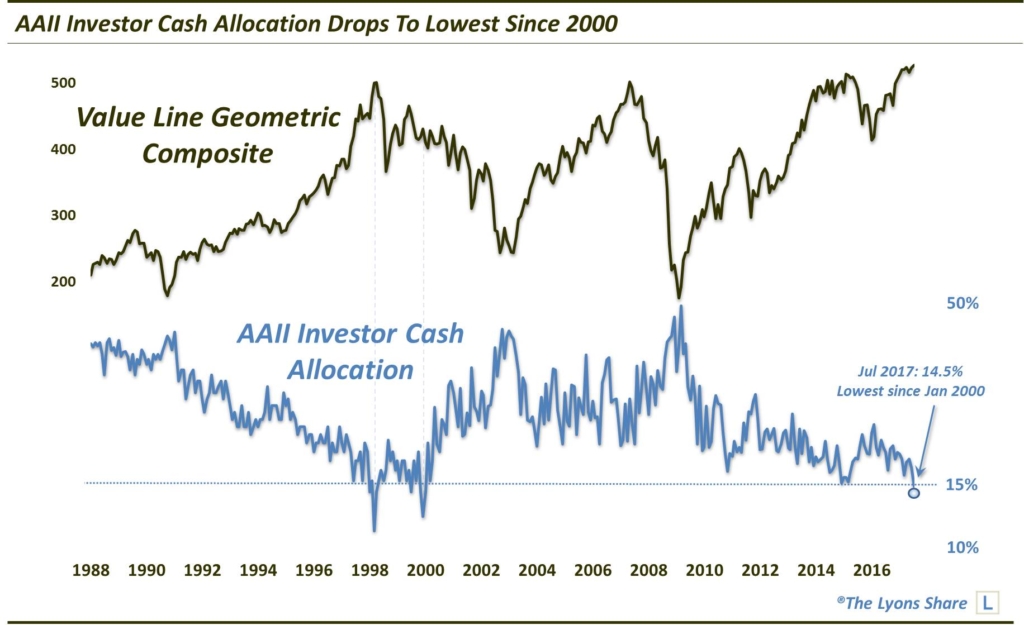
The statistic to which we are referring — and the subject of today’s Chart Of The Day — relates to the level of investor assets that is currently allocated to cash. This metric can carry important investor sentiment value as, historically, cash levels are low near market tops and become elevated at market bottoms. This particular metric comes from the American Association of Individual Investors (AAII) survey on investor allocation, and the current reading reeks of the former situation.
Specifically, the July 2017 reading of investor cash came in at 14.5%. This was the lowest level in the survey since January 2000. In fact, the only lower readings in the survey’s history back to 1987 occurred in January-April 1998, July 1999 and November 1999-January 2000.
Is now the time to freak out about this low cash position? Probably not. Remember, market conditions have to be ripe for these secular, or cyclical, types of issues to unleash their ramifications. Given the close proximity of most market averages to all-time highs, we don’t think we’re at that point yet.
That said, this is certainly a counterpoint to the “cash on the sidelines” argument. That just doesn’t appear to be accurate. So while a crash, or even a major market top, may not be imminent, background market conditions are not at all favorable for a further, prolonged advance.
Just our 2 cents.
_____________
Disclaimer: JLFMI’s actual investment decisions are based on our proprietary models. The conclusions based on the study in this letter may or may not be consistent with JLFMI’s actual investment posture at any given time. Additionally, the commentary provided here is for informational purposes only and should not be taken as a recommendation to invest in any specific securities or according to any specific methodologies. Proper due diligence should be performed before investing in any investment vehicle. There is a risk of loss involved in all investments.


2 Comments