Is Global Stock Rally Hitting A Wall? (PREMIUM-UNLOCKED)
**The following post was originally issued to TLS subscriber on August 9, 2017.**
A key global equity index is testing potentially major resistance.
Unlike in recent years when the U.S. market dominated, stocks around the globe have been on fire this year. Just yesterday, we mentioned the latest great looking breakout underway in the South African stock market. Of course, with all of these individual countries exhibiting strength this year, it stands to reason that the broader indices would also be performing well. One such index is The Global Dow Index (GDOW).
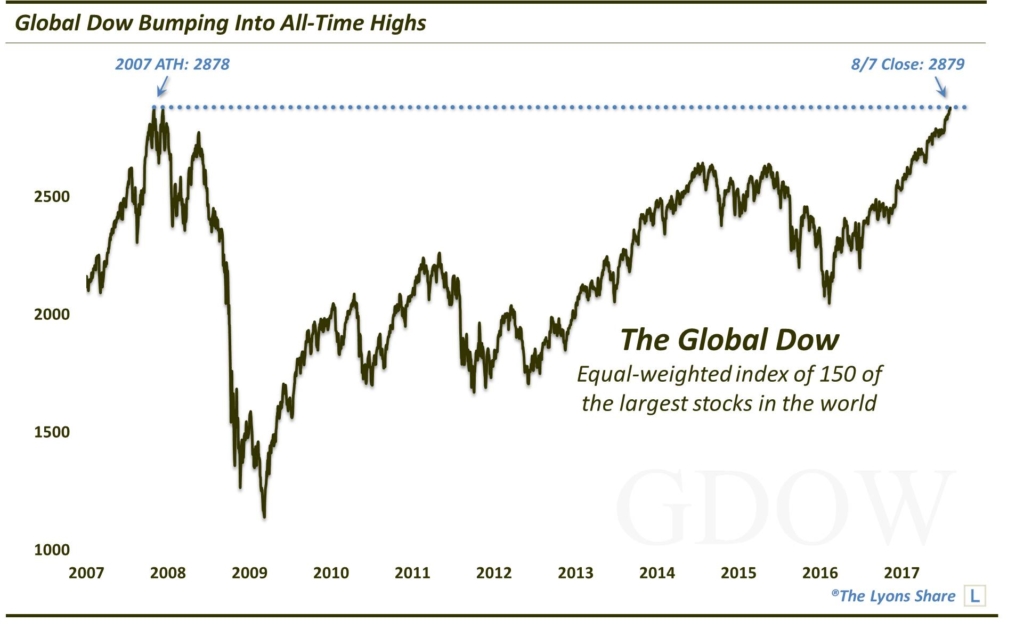
The Global Dow is an equally-weighted index of 150 of the largest stocks in the world and it is one of our favorite barometers of the state of the worldwide equity market. Coming into 2017, we mentioned that the GDOW was facing significant resistance in the form of a 10-year Down trendline stemming from its 2007 all-time high of 2878.
After holding for about a month, the GDOW was able to surmount the trendline (near the 2590 level at the time) by late January. That opened the upside in the GDOW to that 2007 all-time high of 2878. Of course, that meant a further 11% rally in the index to get there. Well, roughly 7 months later, the GDOW has arrived.
The red hot index closed on Monday at the 2879 level, equaling its 2007 all-time high.
So, does this mean the global equity rally is doomed? Not necessarily. However, one reason why we like using the Global Dow as a barometer of the global equity market is because it conforms well to technical charting analysis. And certainly classical charting analysis would suggest that 10-year old all-time highs should at least pose as temporary resistance following a decade-long round trip. But how temporary, and how much downside risk may there be prior to another potential breakout?
First off, the 2007 highs absolutely should serve as some resistance. Should the index attempt to breakout without some kind of pause or consolidation first, it would be less than ideal. We certainly would not chase the index into new highs in that instance. It would be much healthier for the GDOW to pullback and/or rest prior to an attempted breakout.
How much of a pullback should we look for? Working backwards a little bit, we see the 2015-2016 decline as a key in judging the potential for the post-2016 rally. Using that decline, an eventual target of 3025 seems to be reasonable, if not likely, based on Fibonacci work. Whether that approximate 5% of additional upside above the current 2879 highs is worth one’s while or not is up to them. However, a pullback into a more inviting level would certainly improve the risk/reward characteristics of a potential long play.
Working off of that 3025 level does help us to confirm the key Fibonacci levels below within the post-2016 rally from which to originate our analysis. And based on that analysis, we would look for a pullback to at least the 2825 level, and ideally the 2810 level before trying a trade. Those levels may offer the rising 50-day simple moving average as additional support, depending upon its whereabouts at the time. It is certainly possible as well that the GDOW retraces its entire post-July rally down to the 2765 level. That would offer an even better risk/reward entry point in the index.
As we mentioned, while we do not typically like to institute targets, either strategically or even mentally, the 3025 level does make a lot of sense as a possible target. Again, that would nicely align the key levels since the 2016 low (and back to 2009, as well) from a Fibonacci standpoint. And while things most certainly do not always “nicely align”, given the fact, as we said, that the GDOW conforms well to charting analysis, a 3025 destination would not surprise us.
So how does one play this opportunity? There is an ETF based off of the GDOW called the SPDR DJ Global Titans Fund, ticker, DGT. Unfortunately DGT is not the most liquid ETF around. However, if one plays it smart, it is typically liquid enough to get enough shares off for a trade.
Anyway, what are the important levels in DGT? It closed yesterday at 79.50. It’s upside target based on the 2015-2016 decline should be near the 84.22 level. We would look for a pullback to either the 77.80or 76.50 level for a favorable risk/reward entry point. That affords us 8%-10% potential upside versus low risk of a close stop below the 76.50 level.
Bottom line? The Global Dow has been on fire this year, along with many areas of the international equity world. It is currently hitting resistance at its 2007 highs, however, which should produce at least a pause or pullback. Such a healthy consolidation could provide the opportunity for a favorable long trade from a risk/reward standpoint, with moderate potential upside above these current all-time highs.
_____________
Disclaimer: JLFMI’s actual investment decisions are based on our proprietary models. The conclusions based on the study in this letter may or may not be consistent with JLFMI’s actual investment posture at any given time. Additionally, the commentary provided here is for informational purposes only and should not be taken as a recommendation to invest in any specific securities or according to any specific methodologies. Proper due diligence should be performed before investing in any investment vehicle. There is a risk of loss involved in all investments.