Key Line Saves French Stocks From Further Damage (PREMIUM-UNLOCKED)
**The following post was originally issued to TLS members on September 1, 2017.
France’s CAC-40 is testing the support of one of the financial markets’ most prolific trendlines.
As many readers are aware, we have a regular feature on Twitter and StockTwits each week called “#TrendlineWednesday”, featuring some of the most noteworthy current trendline developments in the financial markets. As we mentioned on Twitter the other day, there are some weeks when it takes considerable effort to find even a handful of trendline developments meeting the “noteworthy” criteria. Other weeks, there are so many noteworthy trendlines in play that several big ones can’t even make the cut. The latter situation would describe this week. And among the abundance of interesting examples is perhaps the most prolific trendline in all of the financial markets currently being tested: a long-term Down trendline on France’s CAC-40 stock index.
The trendline at hand stems from the CAC-40′s all-time high in 2000 and connects (on a linear scale) the peaks in 2007 and 2015. Back in April, at the time of the presidential elections in France, the CAC-40 found itself again testing the 17-year Down trendline. Following the elections, the CAC-40 finally hurdled the long-term trendline — and in dramatic fashion, gapping up by more than 4%.
After brief follow-through into early May, the CAC-40 began a long, steady descent back toward the breakout level of the trendline. As markets and securities tend to do, eventually, the CAC-40 filled the April 24 gap a couple weeks ago. All that was really left was to test the broken trendline, presently intersecting near the 4995 level. On Tuesday, amid the North Korea-inspired market jitters, the CAC-40 finally did test the trendline again, making a low of 4995.07 before immediately bouncing.
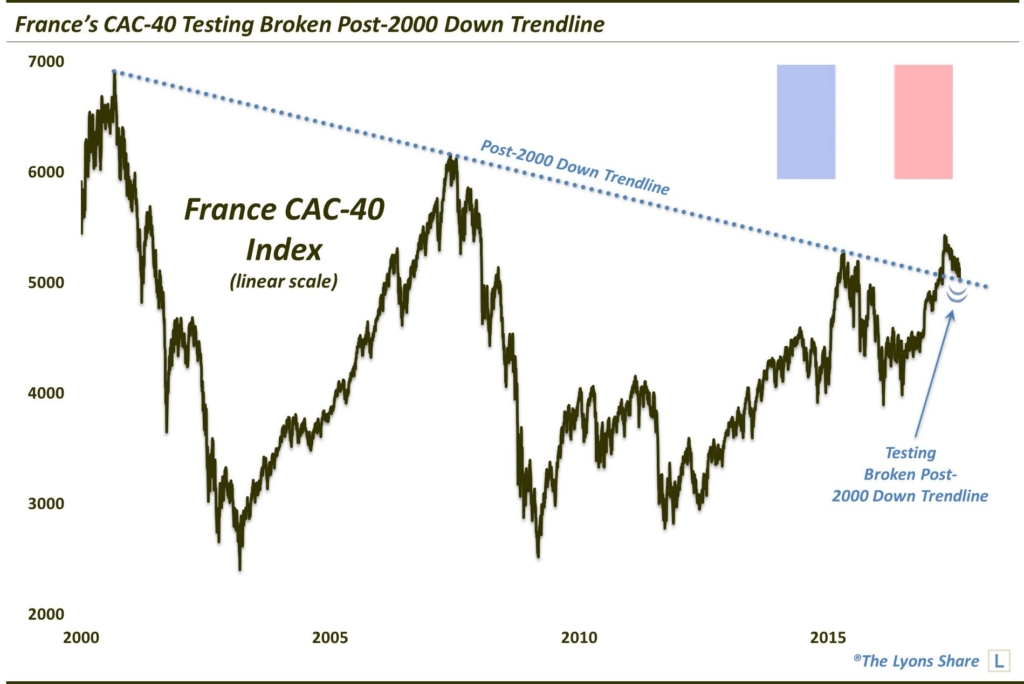
Presently, the CAC-40 is trading at 5135, up nearly 3% in a straight line off of its trendline test. For those who still think this type of analysis is some kind of voodoo, the odds of a random precise reaction off of a 17-year trendline like this would be astronomical. We’re happy to have them continue to think these kinds of events are random and that markets are efficient and all that stuff. That’s what gives the rest of us an edge.
So what’s next for the CAC-40? Naturally, as long as the trendline, i.e., former resistance, continues to act as support, expect the CAC-40 to continue its bounce. How much of a bounce do we expect?
At this point, we are only looking for a mean-reversion bounce, i.e., a retracement of the post-May decline. If it wasn’t for our skitteshness over the intermediate-term regarding developed markets around the world, we’d be much more sanguine about this development in the near-term. It is entirely possible that an intermediate-term correction this fall sees the CAC-40 continue to hold above this line. And after such a correction runs its course, the index may initiate a more durable rally, towards its previous peaks and beyond.
As it is, we are looking for bounces to the following levels in the CAC-40:
- 5167
- 5272-5300
Should the trendline fail to hold prices, the clear subsequent support levels below are as follows:
- 4840
- 4480
As far as what vehicle to use in attaining French equity exposure, there is only 1 French ETF that we are aware of, the iShares MSCI France ETF, ticker, EWQ. Given its limited holdings and, especially, the currency effects of the Euro, the EWQ does not track the CAC-40 perfectly. As of late, it has actually been much stronger than the index given the Euro’s considerable strength. Therefore, it’s tricky to play this CAC-40 set-up, unless one has access to the futures market. But, as long as the trendline continues to hold, the EWQ should benefit.
If you’re interested in the “all-access” version of our charts and research, we invite you to check out our new site, The Lyons Share. Considering the potentially treacherous market climate, there has never been a better time to reap the benefits of our risk-managed approach. Thanks for reading!
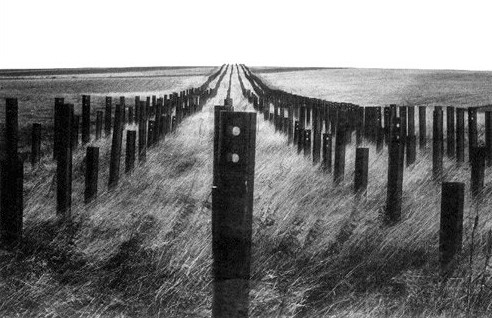
Photo is of part of The Maginot Line, a line of fortifications, obstacles, and weapon installations built by France in the 1930s to deter invasion by Germany.
_____________
Disclaimer: JLFMI’s actual investment decisions are based on our proprietary models. The conclusions based on the study in this letter may or may not be consistent with JLFMI’s actual investment posture at any given time. Additionally, the commentary provided here is for informational purposes only and should not be taken as a recommendation to invest in any specific securities or according to any specific methodologies. Proper due diligence should be performed before investing in any investment vehicle. There is a risk of loss involved in all investments.