
A 52-“Weak” High For Stocks? (PREMIUM-UNLOCKED)
While the S&P 500 his on an impressive string of new highs, a number of them have come on questionable breadth.
When it comes to analyzing the quality of a stock market rally, we are big on breadth, or the internals, of the market. The more participation there is on the part of all stocks, the better the foundation to support the rally. If the rally is reliant on only a relatively few large stocks, it only takes a few stocks breaking down to undermine the advance. On that basis, the quality of the post-August rally has been, for the most part, superb. The validity of that assessment over the past few weeks, however, has come into question due to an odd string of new highs.
Specifically, the S&P 500 has recorded 5 all-time highs over the past 10 days. Interestingly, 3 of those have occurred on negative NYSE breadth, i.e., more NYSE declining stocks than advancing stocks. If that seems unusual, it’s because it is. Looking back in our database to 1965, we find only 3 other 2-week stretches containing at least 3 new highs occurring on negative breadth:
- 3/20/1995
- 6/20/1997
- 12/14/2010
The concern with these clusters of negative breadth new highs is that the rally participation may be starting to wane. Thus, despite the new highs in the average, the market may be getting more vulnerable.
Looking back at the prior clusters, did the performance of the S&P 500 bear out that concern? Well, the sample size is a minuscule 3 – but the evidence would clearly suggest no. We won’t present the full performance table following those 3 precedents, but we’ll say that 2 months later, the S&P 500 was higher by at least 4.5% each time. Furthermore, the worst 6-month drawdown of any of the 3 events was a mere -2.4%.
So, that puts some of the concern about weakening internals to rest – but, again, only based on 3 occurrences. We’d prefer a larger sample size in order to place any real measure of confidence in the data. If we relax the parameters a bit and look at clusters of just 2 negative breadth new highs within a 10-day span, we come up with 14 unique occurrences in 52 years, prior to the current one.
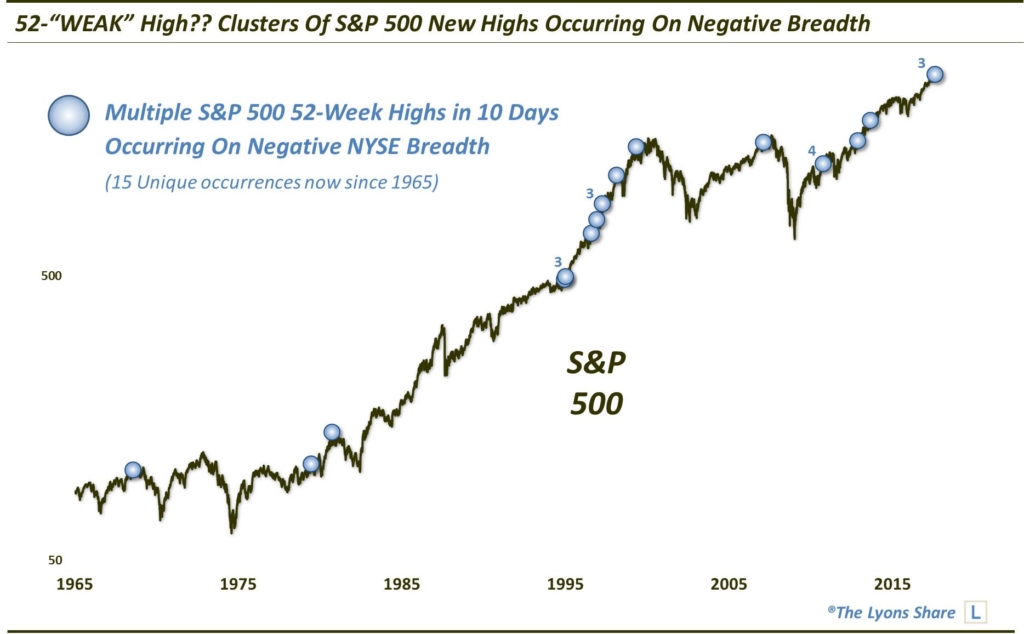
So does this larger sample size add validity to the concern about weakening internals? As the chart reveals, a number of the occurrences certainly took place in the vicinity of intermediate-term, or even cyclical, tops. But what about in aggregate? Is the signal a consistent enough warning to warrant our attention? Let’s check out the full post-event performance history:
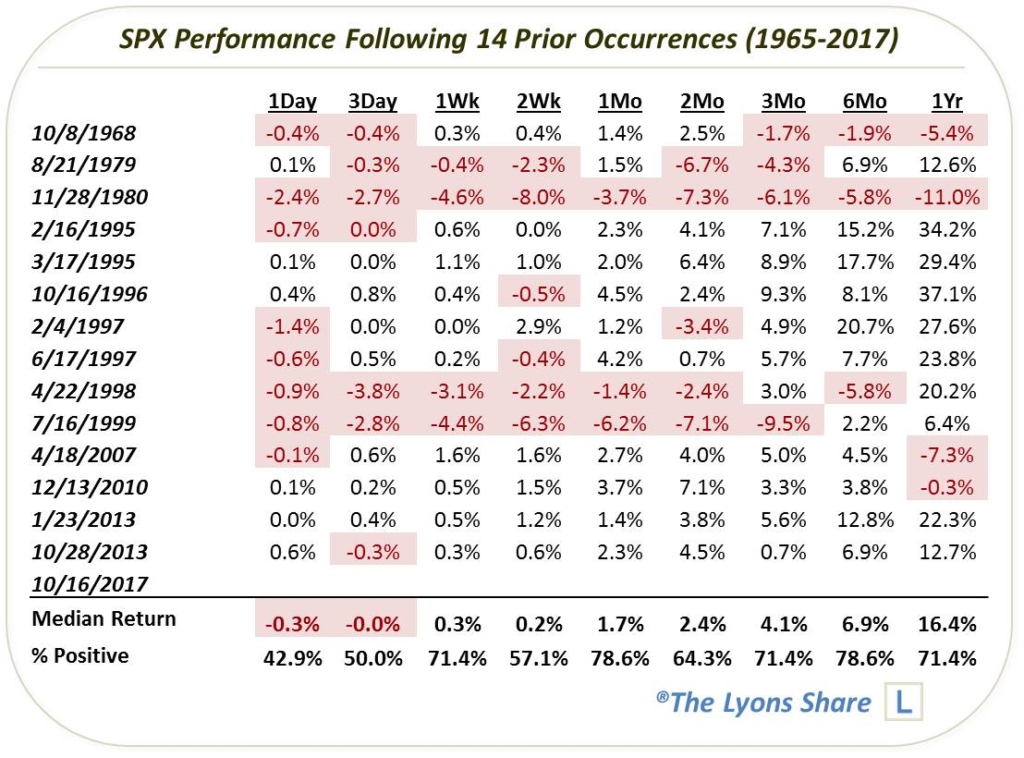
Overall, the S&P 500′s performance following these events is pretty solid, with slightly above average median returns over most time frames. However, it has been anything but consistent. There were, again, a handful of events, e.g., 1968, 1979, 1980, 1998, 1999, that preceded sizable drawdowns in the intermediate-term – or even full-on bear markets.
So, is there any distinguishing market characteristic that delineates the good episodes from the bad? And on which side does our present case fall? As you know, we are generally able to isolate a condition or two in these studies that has led to a consistent pattern of behavior in the market. This time, however, it was a struggle to find such a pattern. No matter which way we parsed the data, the results seemed to come up mixed.
About the only pattern we identified, and a loose one at that, was that the index’s short-term performance often foretold of its longer-term fate. For example, each of the 4 events that saw the S&P 500 lower 1 week later were also down 3-6 months later. Besides that pseudo-trend, the results seemed to genuinely be of a random nature. Eventually, we stopped looking for a “magic” indicator delineating the good episodes from the bad, as our efforts began to head dangerously down the data-mining path.
So what’s the bottom line here? This study is a difficult one to put much stock into, so to speak. Multiple S&P 500 new highs occurring on negative NYSE breadth in a 2-week period have led to mixed results, though, more good than bad. Perhaps the most instructive thing we can say is that these events have not been a consistently accurate warning of weakening internals and a vulnerable market.
We certainly would not consider this development to be a bullish signal. However, if you want to find something to worry about when it come to the stock market, there are much better candidates than this one.
This is a free look at the “all-access” versions of our charts and research that we post daily (among much more) on our new site, The Lyons Share. TLS is currently running a 30th anniversary 1987 Crash Commemoration SALE, offering a discount of 22.6%, or the equivalent of the Dow’s 1-day drop 30 years ago. The SALE ends October 22 so considering the discounted cost and a potentially frothy market climate, there has never been a better time to reap the benefits of our risk-managed approach. Thanks for reading!
_____________
Disclaimer: JLFMI’s actual investment decisions are based on our proprietary models. The conclusions based on the study in this letter may or may not be consistent with JLFMI’s actual investment posture at any given time. Additionally, the commentary provided here is for informational purposes only and should not be taken as a recommendation to invest in any specific securities or according to any specific methodologies. Proper due diligence should be performed before investing in any investment vehicle. There is a risk of loss involved in all investments.


