
“Most Hated” Rally Getting Record Love
A recent reading in one broad measure of consumer stock market sentiment was among the most bullish in history.
Perma-bulls like to label this bull market the “most hated” in history. While the rally is historic by some metrics, the “most hated” status, to the degree that it was ever applicable, has certainly fallen by the wayside by now. To be sure, there are plenty of vocal and visible perma-bears that have been spewing copious amounts of “hate” at this rally for years now. However, if one steps away from the confines of financial social media and guru-dom, evidence shows that public sentiment has grown to now reflect among the most bullish conditions in recorded history.
While there hasn’t been a flashy, parabolic melt-up sucking up investor capital, it’s likely that the sheer duration and overall magnitude of the bull market has had a cumulative effect on investor sentiment. One example comes from our Chart Of The Day based on the University of Michigan’s Survey of Consumers. One of the questions asked of respondents in the survey is their estimation of the “probability of an increase in the stock market in the next year”. Among the various ways that UM breaks down the data is by taking the mean response to that question. And in August’s survey, the mean response came in at 62.7%.
That trails only June 2015‘s 63.1% and joins July 2007‘s 62.2% as the only 3 readings above 62% in the history of the survey.
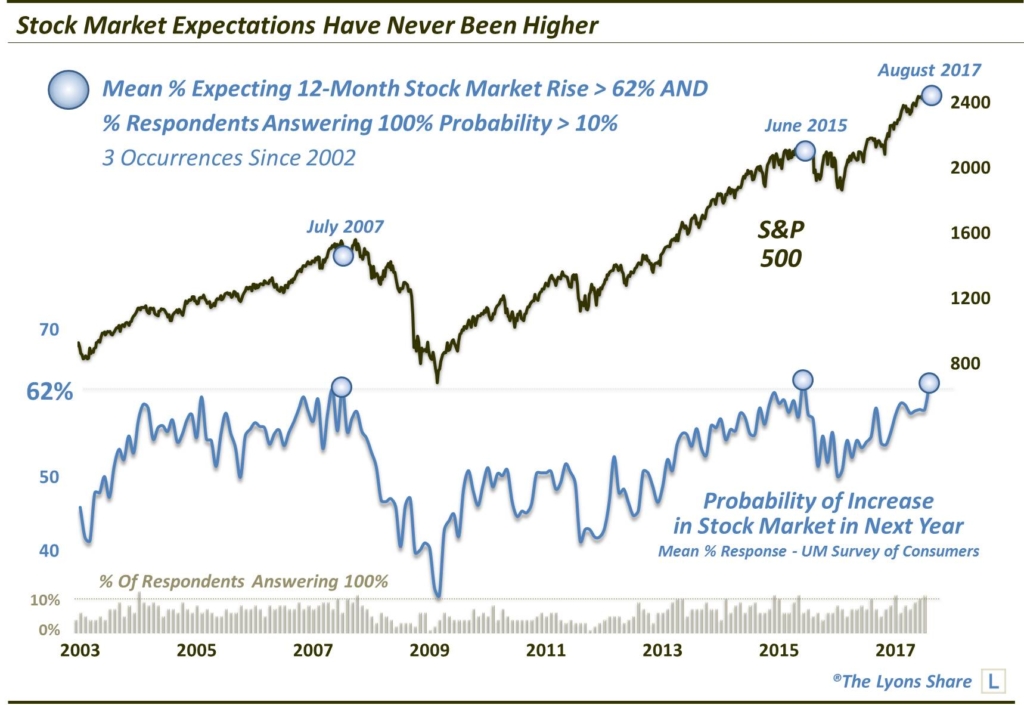
Now admittedly, the data series has only been around since 2002. However, it should at least put to rest the moniker of “the most hated rally in history”. It should also serve as a red flag regarding the longer-term prospects of the current rally. It certainly is possible that the survey reading gets more extreme, and that stocks continue to run higher in the meantime. However, given the nearly immediate negative aftermath following the prior 2 extreme readings, the odds are probably stacked against a sustainable longer-term rally.
Another interesting breakdown provided by the survey looks at extreme responses rather than the mean. When tallying the survey results, the UM breaks the responses down by quartiles (i.e., the % of respondents expressing a probability between 1%-24%, 25%-49%, etc.). They also provide the percentage of respondents who say there is a 0% chance of a stock market rally over the following year as well as the percentage of respondents saying there is a 100% chance. Not surprisingly, a high level of these respective responses have come at interesting junctures, i.e., the wrong junctures.
In August, 11% of respondents answered that there was a 100% chance of a market rally over the next year. Since 2002, these are all of the months when “100%” represented at least 11% of respondents.
- February 2004 (12%)
- November 2007 (11%)
- January 2015 (11%)
- June 2015 (11%)
- February 2017 (11%)
Obviously the 2007 instance marked a cyclical top. The June 2015 instance preceded a nasty intermediate-term decline. The others preceded, at best, several months of no progress for the stock market. After a few months following the reading this past February, the large-cap area of the market did resume making higher highs. However, the broad market made no progress at all until this past month.
Again, this sentiment reading does not guarantee the imminent end to the stock market rally. Indeed, there is nothing to say these data points can’t go to more extreme levels — even unprecedented levels. However, surveys like this represent what we call “background indicators”. These “soft” data points that don’t necessarily constitute actionable signals or triggers. Rather, we view them as measures of longer-term “potential risk” in the market.
This potential risk can persist for some time until a catalyst comes along that causes this potential risk to turn into manifested risk. The greater the potential risk, the greater the manifested risk tends to be when such a catalyst shows up. And, at least based on this survey, the longer-term potential risk is about as high as we’ve seen it in the market. It certainly doesn’t lend credence to the “most hated bull market” argument.
Oh, and as a reminder, this survey reading was as of August. If they loved ’em in August, we can’t wait to see the September reading.
If you’re interested in the “all-access” version of our charts and research, please check out our new site, The Lyons Share. Considering what we believe will be a very difficult investment climate for awhile, there has never been a better time to reap the benefits of our risk-managed approach. Thanks for reading!
_____________
Disclaimer: JLFMI’s actual investment decisions are based on our proprietary models. The conclusions based on the study in this letter may or may not be consistent with JLFMI’s actual investment posture at any given time. Additionally, the commentary provided here is for informational purposes only and should not be taken as a recommendation to invest in any specific securities or according to any specific methodologies. Proper due diligence should be performed before investing in any investment vehicle. There is a risk of loss involved in all investments.


21 Comments