
Small-Caps Seeing Historic Squeeze (PREMIUM-UNLOCKED)
There has only been one trading range in the history of the Russell 2000 tighter than the current one — and it immediately preceded a crash.
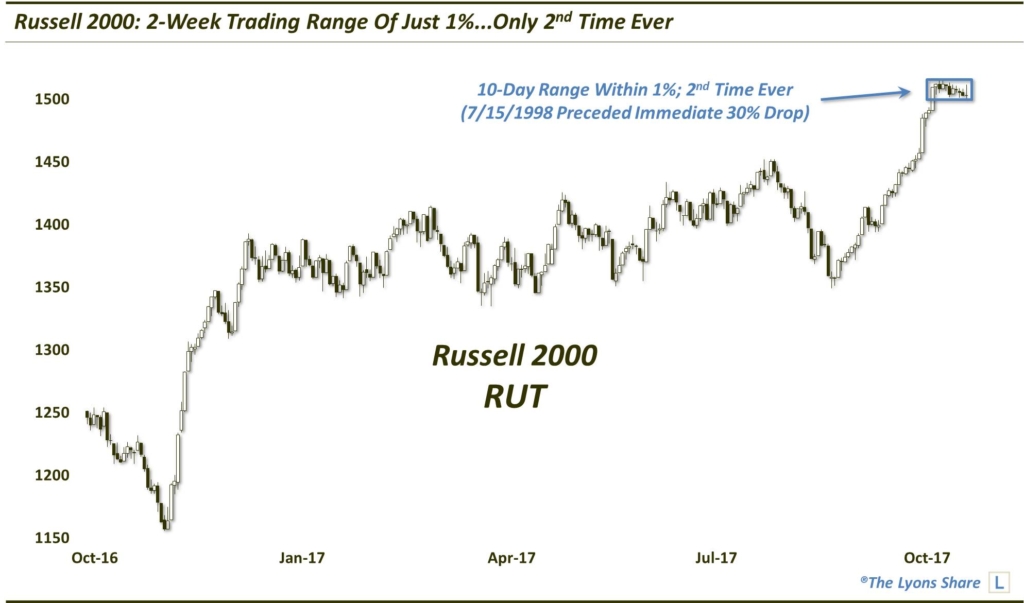
As U.S. large-cap stocks continue to make new highs seemingly every day, the small-caps are doing something remarkable. Or, more accurately, it is what they aren’t doing that is remarkable. They aren’t moving at all — almost literally. In the past 2 weeks, the Russell 2000 Small-Cap Index (RUT) has amazingly traded within a range of just 1% (actually 1.01%…but close enough). This is just the 2nd time in its history (along with July 15, 1998) that it has traded for 10 straight days within an overall range of just 1%.
What, if anything, can we reasonably expect from the RUT following the culmination of this historic lack of movement? Well, tight ranges like this are often a precursor to a spike in volatility, at least in the near-term, as the range break releases the considerable coiled-up potential energy. But which way will it break — up or down?
Unfortunately, we don’t have a crystal ball. Both outcomes are plausible and explainable (often after the fact in the case of the latter). These tight ranges can constitute a continuation pattern in which prices digest the prior move before “continuing” in that same direction, e.g., up, in this case. However, the lack of movement within these tight ranges can also signify indecision — and can precede direction changes.
The July 1998 event, which, at 0.99%, is the only 2-week range in the RUT’s history tighter than the current one, occurred on the heels of a bounce as well. That event would mark a direction change — and immediately precede a 3-month crash of nearly 35%.
That is but one precedent, however, which is certainly inadequate in forming statistically sound expectations for our present case. If we loosen the parameters a bit, perhaps we can find a little more instruction. In this case, if we broaden the 10-day range parameters to 1.25%, we come up with 7 more unique occurrences over the past 27 years. Perhaps that’s a little more helpful.
Here are the dates we came up with:
- 5/19/1993
- 6/22/1993
- 7/30/1993
- 9/13/1994
- 3/24/1995
- 5/10/1995
- 2/20/1996
- 7/15/1998
- 10/16/2017
As you can see, most of the occurrences happened during the low-volatility era of the mid-1990s. In fact, that 1998 event was the last one prior to our current case. That makes the RUT’s current trading range seem even more remarkable. But what will it lead to?
Let’s take a look at what transpired following the 8 prior events.
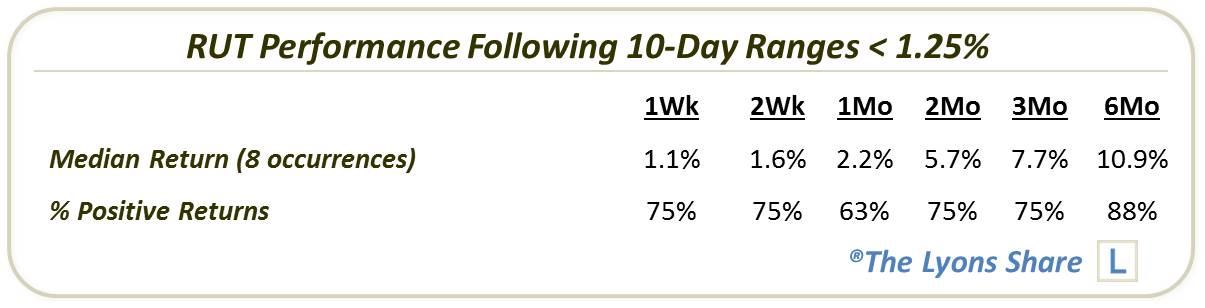
Without zeroing in on whether these incidents signified continuation patterns or reversals, the first thing that stands out is that the aggregate performance following these precedents is significantly positive. Of course, a sample size of 8 is hardly robust; however, we can at least dismiss fears that the pattern is necessarily bearish.
There is still the matter of the 1998 occurrence which led to an immediate loss of a third of the Russell 2000′s value, not to mention whatever other incident led to losses in the 2 and 3-month time frame. Looking at the 1998 incident a bit closer, we see that, while the RUT had bounced for about a month prior to the 10-day range, the bounce came on the heels of a multi-month decline from 52-week highs. Thus, unlike today’s range, the 1998 version occurred with the RUT well off of its highs, by 6% to be exact. In reality, the appearance of the 1998 range resembled more of a bear-flag, i.e., a continuation pattern downward, than today’s bull-flag looking formation.
That got us thinking about what the other 7 occurrences looked like. Thus, as we like to do, we measured the RUT’s distance from its 52-week high at the time of each incident. Upon inspection, one of the other 7 events saw the RUT over 5% below its 52-week high at the time of the 2-week range — the September 1994 occurrence. As it turns out, the RUT was lower following that event from 1 week to 3 months, with a 3-month drawdown of -8.5%.
The other 6 events occurred with the RUT closer to its 52-week high, i.e., within roughly 3%. Of course, those 6 saw the RUT perform almost flawlessly going forward. Here is the aggregate performance following all of the events, delineated by the RUT’s distance from its 52-week high.
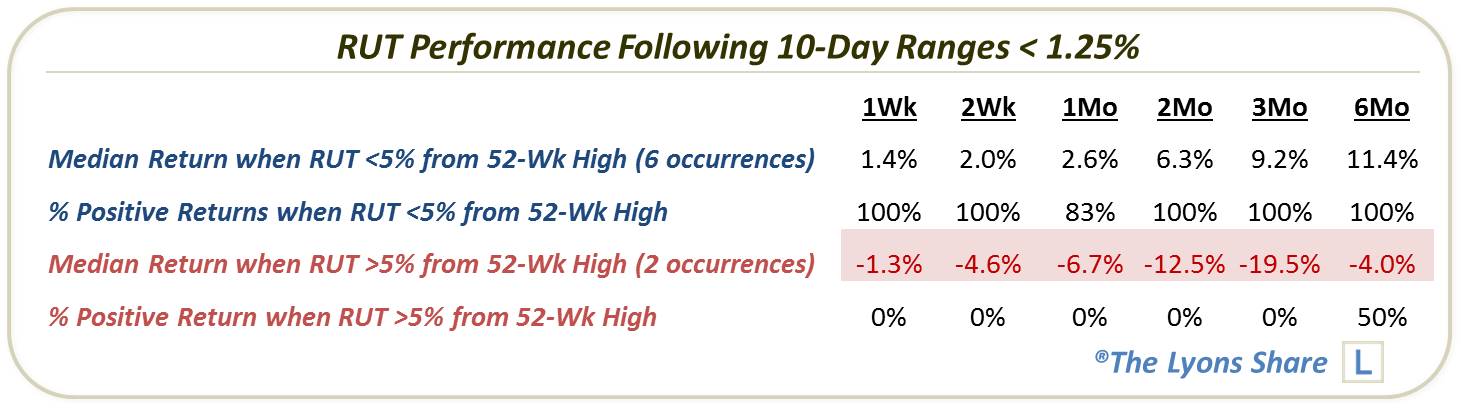
We want to be careful not to make too much of this study containing just 8 samples, especially as none of them even took place in the past 19 years. However, to the extent that we can draw any conclusions from reasonably similar extremely tight ranges in the past, the fact that the Russell 2000 is less than 1% from its 52-week high should have bulls feeling pretty good about the evidence.
This is a free look at the “all-access” versions of our charts and research that we post daily (among much more) on our new site, The Lyons Share. TLS is currently running a 30th anniversary 1987 Crash Commemoration SALE, offering a discount of 22.6%, or the equivalent of the Dow’s 1-day drop 30 years ago. The SALE ends October 22 so considering the discounted cost and a potentially frothy market climate, there has never been a better time to reap the benefits of our risk-managed approach. Thanks for reading!
_____________
Disclaimer: JLFMI’s actual investment decisions are based on our proprietary models. The conclusions based on the study in this letter may or may not be consistent with JLFMI’s actual investment posture at any given time. Additionally, the commentary provided here is for informational purposes only and should not be taken as a recommendation to invest in any specific securities or according to any specific methodologies. Proper due diligence should be performed before investing in any investment vehicle. There is a risk of loss involved in all investments.


