
Options Traders Furiously B.T.D.
Despite the down day yesterday, one indicator from the equity options market recorded a massive spike in bullishness.
We like to track metrics from the various stock options exchanges as a measure of stock market sentiment. Generally, when too many calls are being bought versus puts, it is a warning of overheated bullishness, and when put volume becomes extreme relative to calls, it can be a sign of excessive fear. One particular indicator we used to track closely was the International Securities Exchange’s Call/Put Ratio on equity options (ISEE). For years, the ISEE was particularly helpful in signaling bullish or bearish extremes. We’re not sure what changed, however, in recent years the indicator has been of little to no value in that regard (in our assessment). We do still continue to monitor it, though, just in case it gives readings that raise our antennae. Yesterday’s reading did.
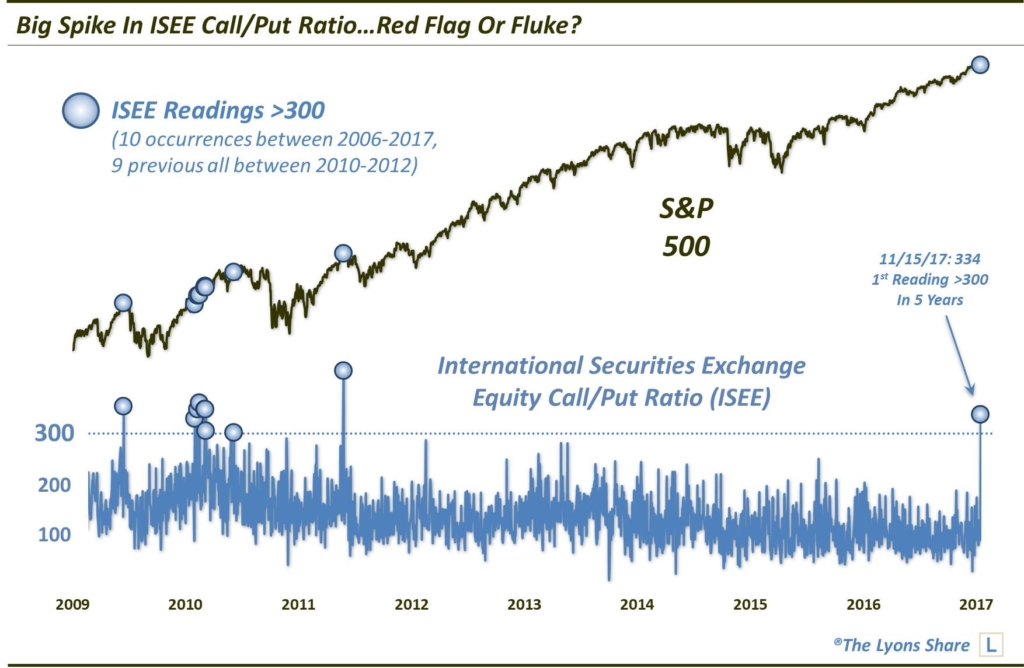
In the past, ISEE readings above 200, i.e., 2 calls bought per every put, have arguably been considered excessively bullish. There have not been nearly as many of these readings in recent years, so yesterday’s number was alarming to say the least. At a reading of 334, it was the highest ISEE recorded in 5 and a half years – and just the 10th ever above 300 since its 2006 inception.
Now, given the fact that we haven’t seen any ISEE readings close to this level in several years, it is possible that this figure was skewed irregularly by activity in a particular stock or stocks. If that’s the case, it may not be a true reflection of trader sentiment, in this case excessively bullish.
However, if we can take this ISEE figure at face value, there are a few potentially concerning aspects to it. First off, as the reading came on a solidly down day in the equity market, it would be concerning that traders are a little too comfortable B.T.D., aka, Buying The Dip. To us, that would be a telltale sign of complacency and a warning that more serious losses may be in store in the market to rid traders of said complacency.
The other concern, obviously, is the sheer magnitude of the reading and what has occurred following similar readings in the past. Again, there have been 9 other readings over 300, all occurring between 2010 and 2012. As the chart shows, a few readings occurred almost precisely at intermediate-term tops, e.g., prior to the Flash Crash in 2010, April 2011 and March 2012. The others occurred during the rally in late 2010 to early 2011, building to the 2011 top.
So, *if* this ISEE reading is to be taken at face value, it is not necessarily a death knell for the rally. But it would suggest that if an intermediate-term top was not at hand, then any further upside may be limited and temporary.
Then again, if the reading is a fluke, long live B.T.D.
If you’re interested in the “all-access” version of our charts and research, please check out The Lyons Share. Find out what we’re investing in, when we’re getting in – and when we’re getting out. Considering that we may well be entering an investment environment tailor made for our active, risk-managed approach, there has never been a better time to reap the benefits of this service. Thanks for reading!
_____________
Disclaimer: JLFMI’s actual investment decisions are based on our proprietary models. The conclusions based on the study in this letter may or may not be consistent with JLFMI’s actual investment posture at any given time. Additionally, the commentary provided here is for informational purposes only and should not be taken as a recommendation to invest in any specific securities or according to any specific methodologies. Proper due diligence should be performed before investing in any investment vehicle. There is a risk of loss involved in all investments.


