“Remember To Come Back In November”
The compliment to “Sell in May and Go Away” doesn’t have a catchy jingle, but the historically best 6-month stretch of the year for stocks begins in November.
“OK, maybe it doesn’t have the same ring to it as its counterpart “Sell in May and Go Away”. However, the dearth of English words that rhyme with November is not an acceptable reason to pay the November-April stretch any less attention. As the “Sell in May…” adage infers, the historical tendency is for the stock market to exhibit below-average performance during the 6 months from May through October. It follows, then, that the November through April period has, on average, delivered superior returns. Consider this a public service announcement to remind you that, while it may not have a catchy slogan, the historically best 6-month stretch of the year is upon us.”
As we mentioned in a post 2 years ago, for some reason, market observers seem more eager to remind investors in spring of the forthcoming 6-month “Sell in May” period than they do the traditionally better 6-month period that begins today. While that tendency may have something to do with former’s catchy catchphrase, it also may have as much to do with the fact that pundits like to promote the doom and gloom stuff more so than the happy fluff. Regardless of the reason, however, it is true that the 6 months from November through April have statistically delivered much better returns, on average, than the May through October period. Here are the performance numbers using returns in the Dow Jones Industrial Average (DJIA) from 1900 to 2015:
- November-April returns have averaged +5.49%, with 70% positive returns
- May-October returns have averaged +1.67%, with 62% positive returns
And in case that does not impress you, consider this:
- $10,000 invested only during May-October periods from 1900-2015 would have grown to $64,980.
- $10,000 invested only during November-April periods from 1900-2015 would have grown to $3,573,094.
So, if you are one of the few remaining stock market bears, that is one reason to be optimistic, at least over the next 6 months.
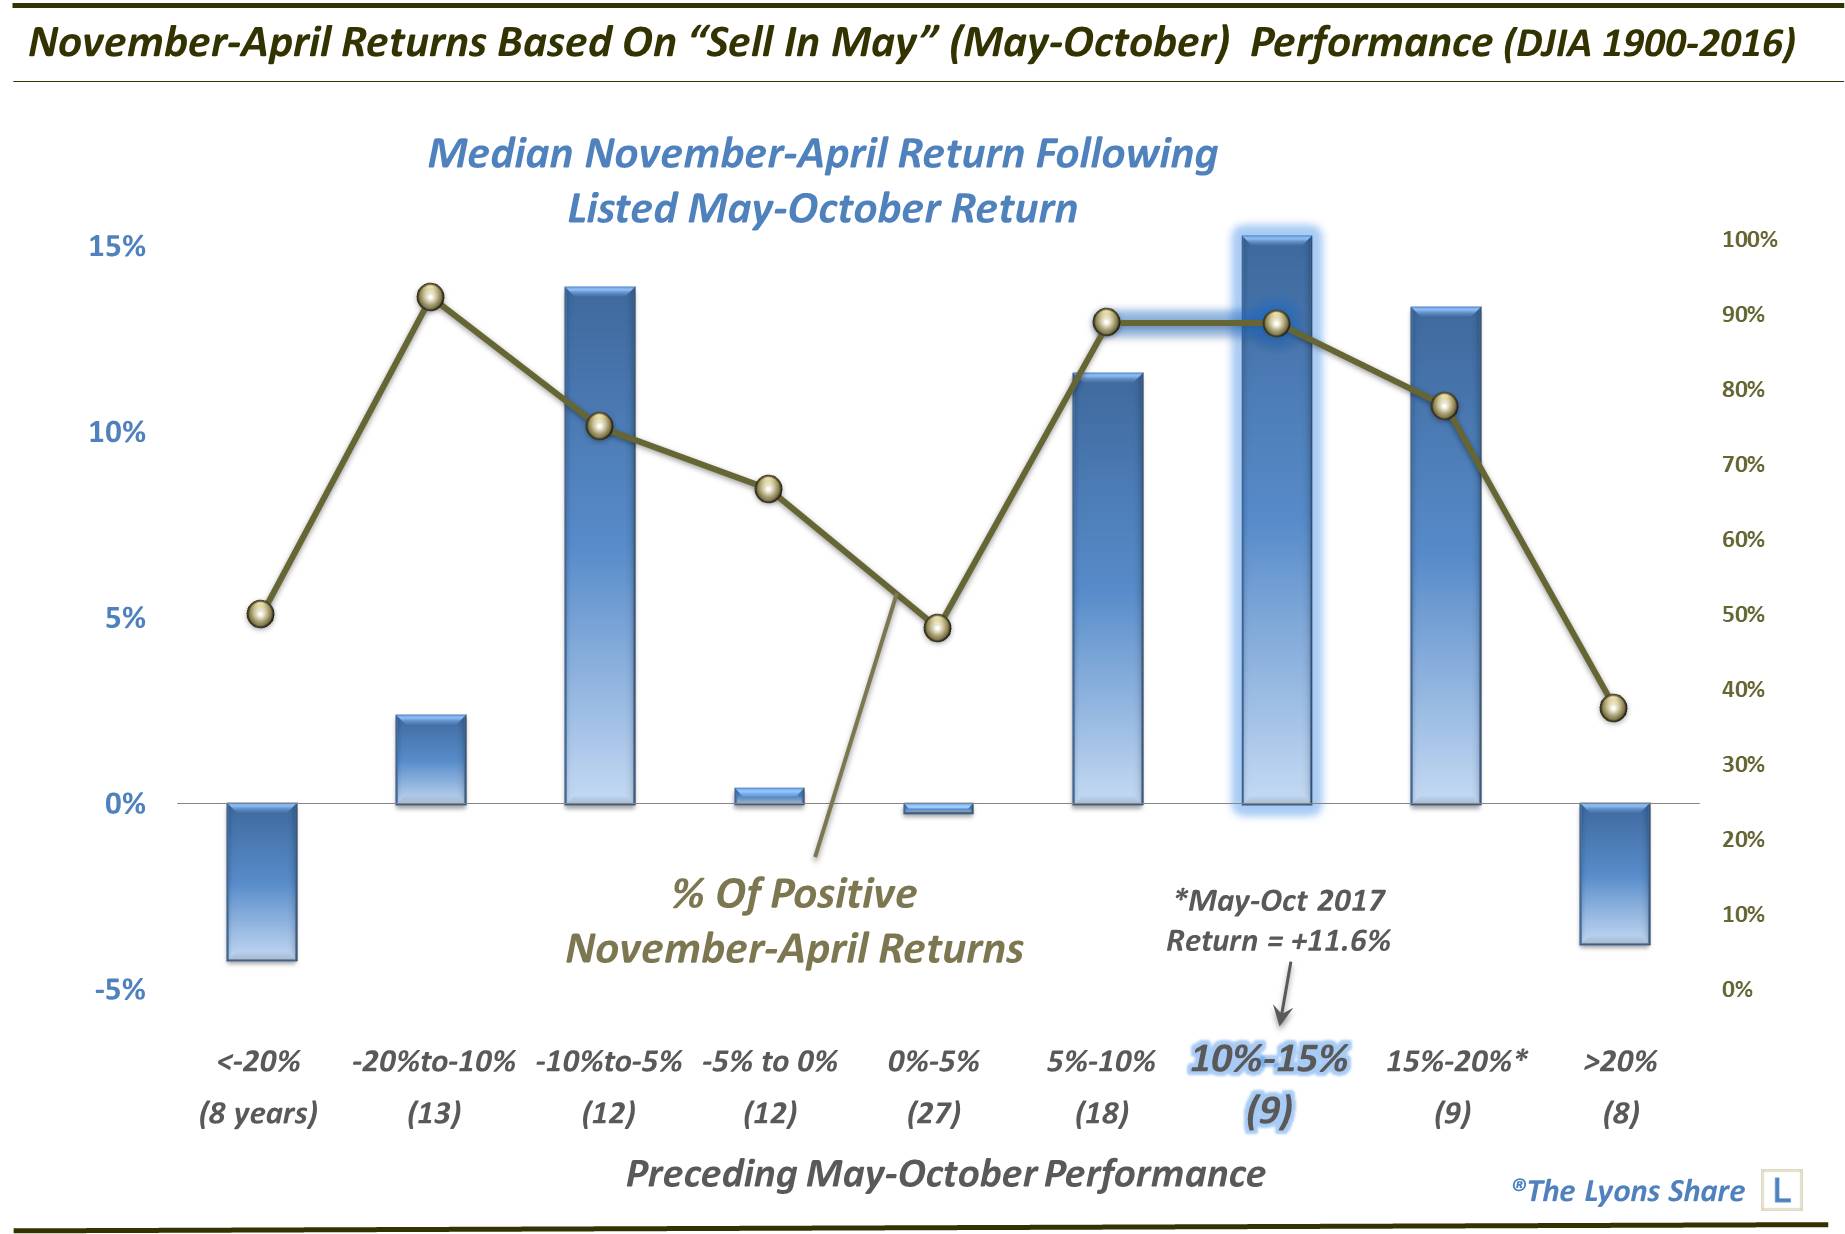
Additionally, as a twist on the seasonal pattern, we wondered how the market’s solid gains over the just-completed “bad” 6-month period (e.g., the DJIA was up more than 11% from May through October) might effect the impending, typically “good”, 6-month period. So we took a look at historical November-April performance based on the DJIA’s preceding May-October returns. The results? More good news for the bulls.

As the chart illustrates, the best November-April returns, on a median basis, have occurred following May-October periods that saw a gain in the DJIA of between 10% and 15% (e.g., this year’s 11.6%). The median November-April return after the 9 such years going back to 1900 was +15.3%. Furthermore, 8 of the 9 such years saw a positive return in the DJIA in the November-April period. Only 1909 saw a loss. And FYI, the years included in this sample of 9 are not all very old nor very recent. They covered 8 different decades spanning from the 1900’s to the 1990’s.
Now, we don’t want to make too much of the whole 6-month pattern. We view seasonality as a subtle headwind or tailwind for stocks and certainly other structural factors present at a given time will carry more influence. However, the pattern has been consistent enough over more than a century’s time that it deserves at least some mention.
At a minimum, if you did paid heed to the “Sell in May and Go Away” advice 6 months ago, it may warrant consideration to “Remember to Come Back in November”.
If you’re interested in the “all-access” version of our charts and research, please check out our new site, The Lyons Share. Considering what we believe will be a very difficult investment climate for perhaps years to come, there has never been a better time to reap the benefits of our risk-managed approach. Thanks for reading!
_____________
Disclaimer: JLFMI’s actual investment decisions are based on our proprietary models. The conclusions based on the study in this letter may or may not be consistent with JLFMI’s actual investment posture at any given time. Additionally, the commentary provided here is for informational purposes only and should not be taken as a recommendation to invest in any specific securities or according to any specific methodologies. Proper due diligence should be performed before investing in any investment vehicle. There is a risk of loss involved in all investments.


