The Global Equity Rally Is Getting ‘Extended’
The All-Country World Index is hitting a trio of key Fibonacci Extensions.
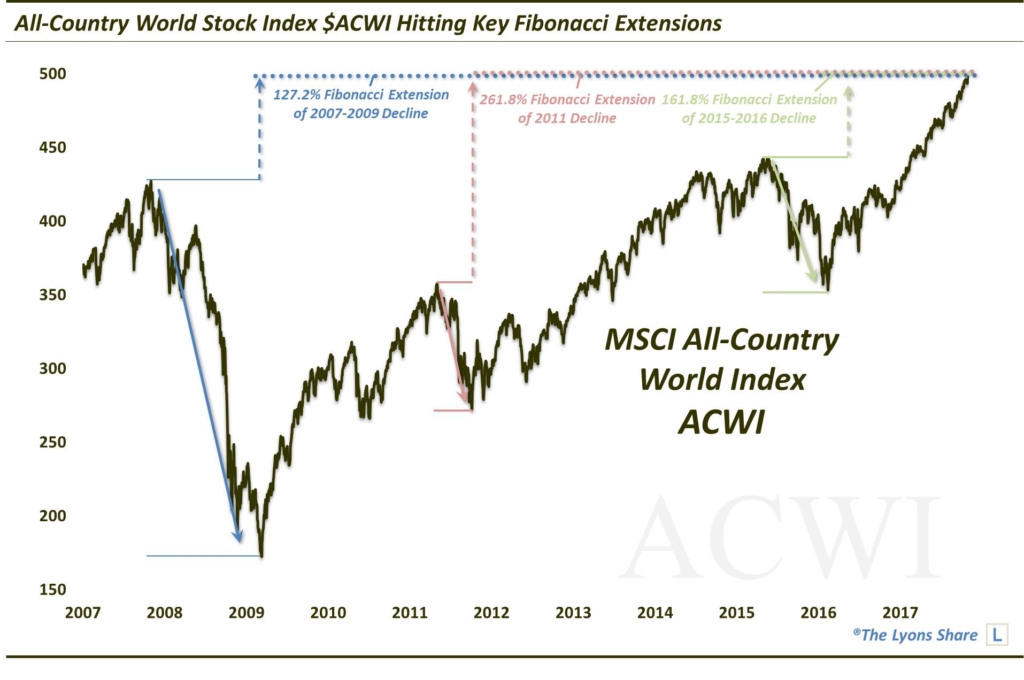
As we have documented ad-nauseam, the relentless equity rally is not merely a U.S phenomenon. As of now, literally every foreign stock market that we track is on pace to close higher in 2017. As such, it is fitting, and unsurprising, that an index called the MSCI All-Country World Index (ACWI) has been on fire this year. After breaking out to new all-time highs in February, the ACWI has added roughly another 13%. And it has done so in persistent fashion with barely a pause along the way. Based on its chart, however, the ACWI is now reaching a level (~500) that may finally halt the rally, if temporarily.
We’ve discussed Fibonacci Extensions in the past on several occasions. As a refresher, these Extensions mark various magnitudes of potential price support or resistance following range breaks, based upon the Fibonacci mathematical sequence. For example, in this case, we see the ACWI now reaching the vicinity of 3 key Fibonacci Extensions of the following noteworthy recent declines:
- The 161.8% Fibonacci Extension of the 2015-2016 Decline
- The 261.8% Fibonacci Extension of the 2011 Decline
- The 127.2% Fibonacci Extension of the 2009-2007 Decline
Here’s what it looks like on the chart.
*Here is an early October post highlighting the potential resistance posed by key Fibonacci Extensions on the chart of the Russell 2000. As it turns out, the small-cap index did indeed stop on a dime upon hitting the Extensions and has been drifting beneath them since.*
Is this the end of the global equity rally? Not likely. However, this is as good a spot as any, in our view, for the ACWI to at least take a breather. It certainly would be compelling enough for us to take some profits in the index.
This is just one of dozens of similar charts we present every day in our Daily Strategy Session videos at The Lyons Share. If you’re interested in this “all-access” view of our charts and research, we invite you to check out the site! Find out what we’re investing in, when we’re getting in – and when we’re getting out. Considering what we believe will be an investment environment tailor made for our active, risk-managed approach, there has never been a better time to reap the benefits of this service. Thanks for reading!
_____________
Disclaimer: JLFMI’s actual investment decisions are based on our proprietary models. The conclusions based on the study in this letter may or may not be consistent with JLFMI’s actual investment posture at any given time. Additionally, the commentary provided here is for informational purposes only and should not be taken as a recommendation to invest in any specific securities or according to any specific methodologies. Proper due diligence should be performed before investing in any investment vehicle. There is a risk of loss involved in all investments.