
The Squid Poised To Break Out Of Bullish Pattern? (PREMIUM-UNLOCKED)
This is a free look at the type of chart setups and analysis we highlight for Premium Members every day at The Lyons Share
The stock of Goldman Sachs may be approaching the culmination (i.e., breakout?) of a decade-long cup-&-handle formation.
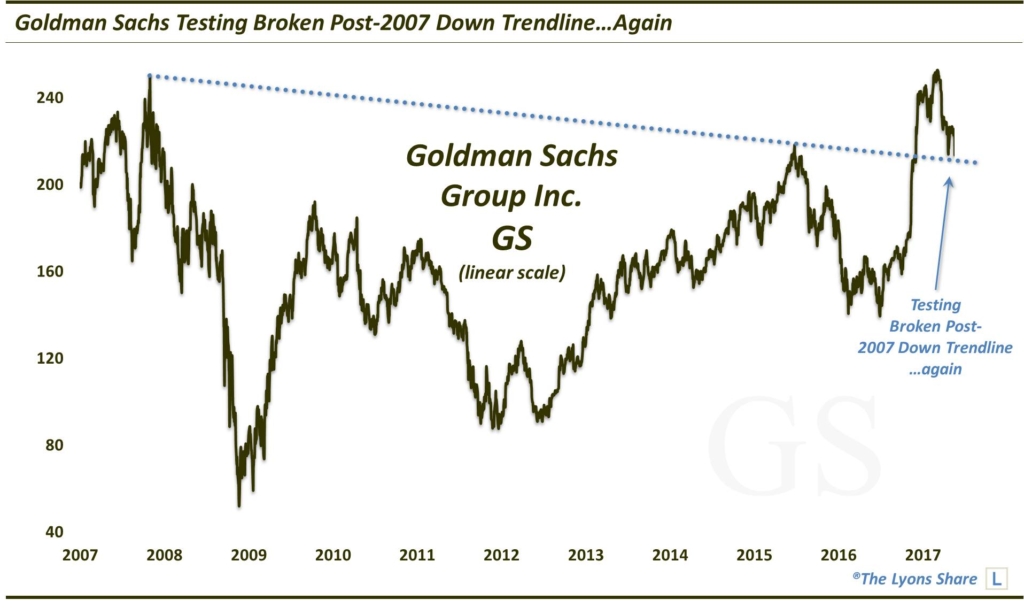
The last time we dedicated a post to the stock of Goldman Sachs (GS), disaffectionately known as the “Vampire Squid”, was in early June (Hunting The Vampire Squid). At the time, GS had just pulled back by about $45 from its March high in the low $250’s. The concern among some chartists was that the stock had topped out back in 2007 precisely at 250, prompting “double top” calls. But while we were hardly financial bulls at the time, we did highlight what we thought was a very favorable potential long setup in GS based on a confluence of key support. As we stated in the post,
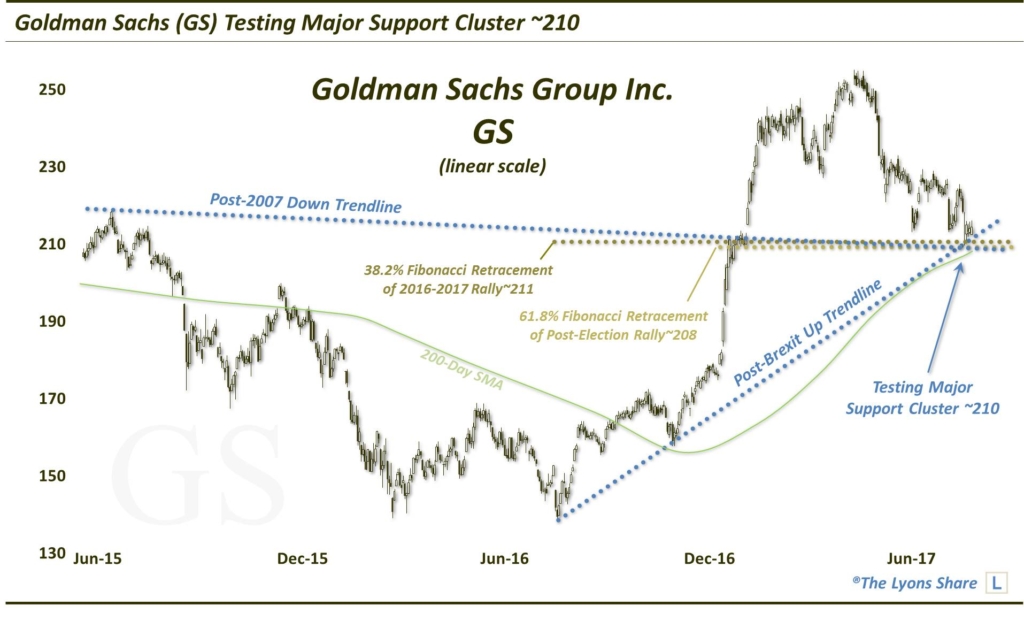
“upon inspection of its chart there is more than a good handful of solid potential support levels in the vicinity of current prices ~210.
Such levels include:
• The Post-2007 Down Trendline
• The Post-Brexit Up Trendline
• The 38.2% Fibonacci Retracement of 2016-2017 Rally
• The 61.8% Fibonacci Retracement of Post-Election Rally
• The 200-Day Simple Moving Average
• The vicinity of the 2015 former All-Time Highs
• The vicinity of the November breakout”
Here are the charts we included at the time.
Zoomed out:
Up close:
As it turns out, the very low in early June was 209.62. From there, the stock rebounded immediately, though, deliberately. At the time, our expectations for the rebound in GS did not necessarily extend beyond some form of a mean-reversion bounce. As the rally in financials gained traction, however, the bounce in GS gathered steam. And now, 6 months later, we find the stock back to its March highs — and 2007 highs — in the low-mid 250’s.
In the process, the Goldman Sachs chart has arguably carved out a decade-long cup-&-handle formation.
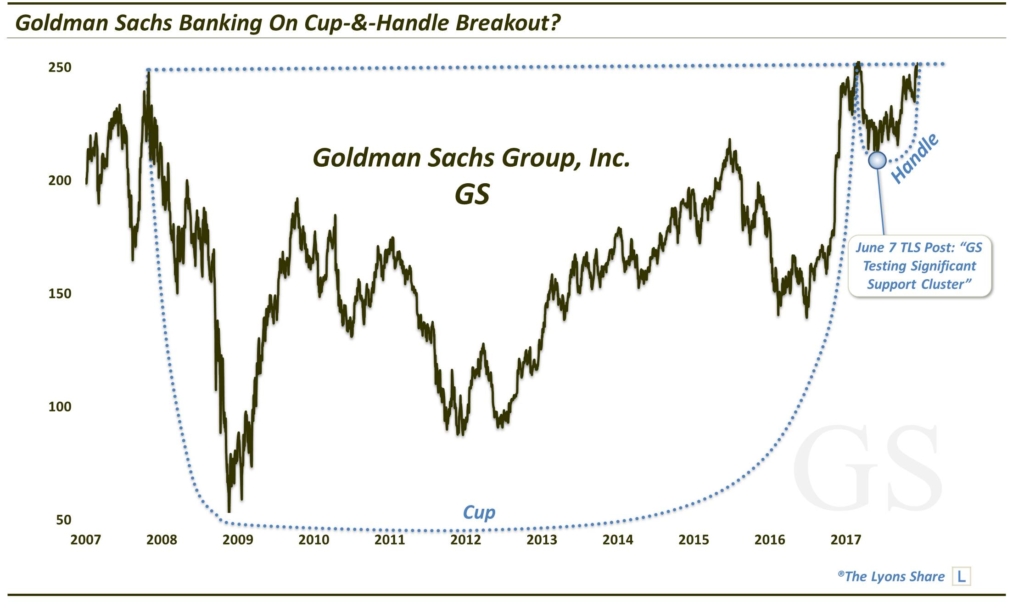
As a refresher, the cup-&-handle is historically a pattern with very bullish implications. It involves 2 parts, generally showing the following characteristics:
The Cup: This phase includes an initial high on the left side of a chart (e.g., the 2007 high in GS around 250), followed by a relatively long, often-rounded retrenchment before a return (e.g., this past March) to the initial high.
The Handle: This phase involves a shorter, shallower dip in the stock and subsequent recovery to the prior highs (e.g., the March-December period in GS).
The bullish theory is predicated on the idea that after taking a long time for a stock to return to its initial high during the “cup” phase, the “handle” phase is much briefer and shallower. This theoretically indicates an increased eagerness on the part of investors to buy the stock since they did not allow it to pull back nearly as long or as deep as occurred in the cup phase. Regardless of the theory, the chart pattern has often been effective in forecasting an eventual breakout and advance above the former highs.
So how high might GS go upon a breakout? Our first (conservative) “target”, based on various Fibonacci analyses as well as the cup-&-handle pattern itself, would be near the 300 level, or nearly 20% above current levels. Ultimately, however, it would not be unreasonable, based on the pattern, to see the stock climb as high as 380-450 eventually, or 50%-80% above current prices.
Obviously, we do not suggest throwing money blindly at any investment without applying some form of risk management. We will, thus, continue to monitor the movement of the Squid as developments unfold and will provide updates via the Daily Strategy Videos.
If you’re interested in the “all-access” version of our charts and research, please check out our new site, The Lyons Share. Considering what we believe will be a very difficult investment climate for perhaps years to come, there has never been a better time to reap the benefits of our risk-managed approach. Thanks for reading!
_____________
Disclaimer: JLFMI’s actual investment decisions are based on our proprietary models. The conclusions based on the study in this letter may or may not be consistent with JLFMI’s actual investment posture at any given time. Additionally, the commentary provided here is for informational purposes only and should not be taken as a recommendation to invest in any specific securities or according to any specific methodologies. Proper due diligence should be performed before investing in any investment vehicle. There is a risk of loss involved in all investments.


